Service Monitoring
A device being reachable doesn’t mean the service running on it is actually working. A web server can answer pings while its login page returns errors; a mail relay can be up while it refuses connections. Service Monitoring closes that gap. It runs active checks — sometimes called synthetic or uptime checks — that reach out to a service on a schedule, confirm it responds correctly, and record how long it took.
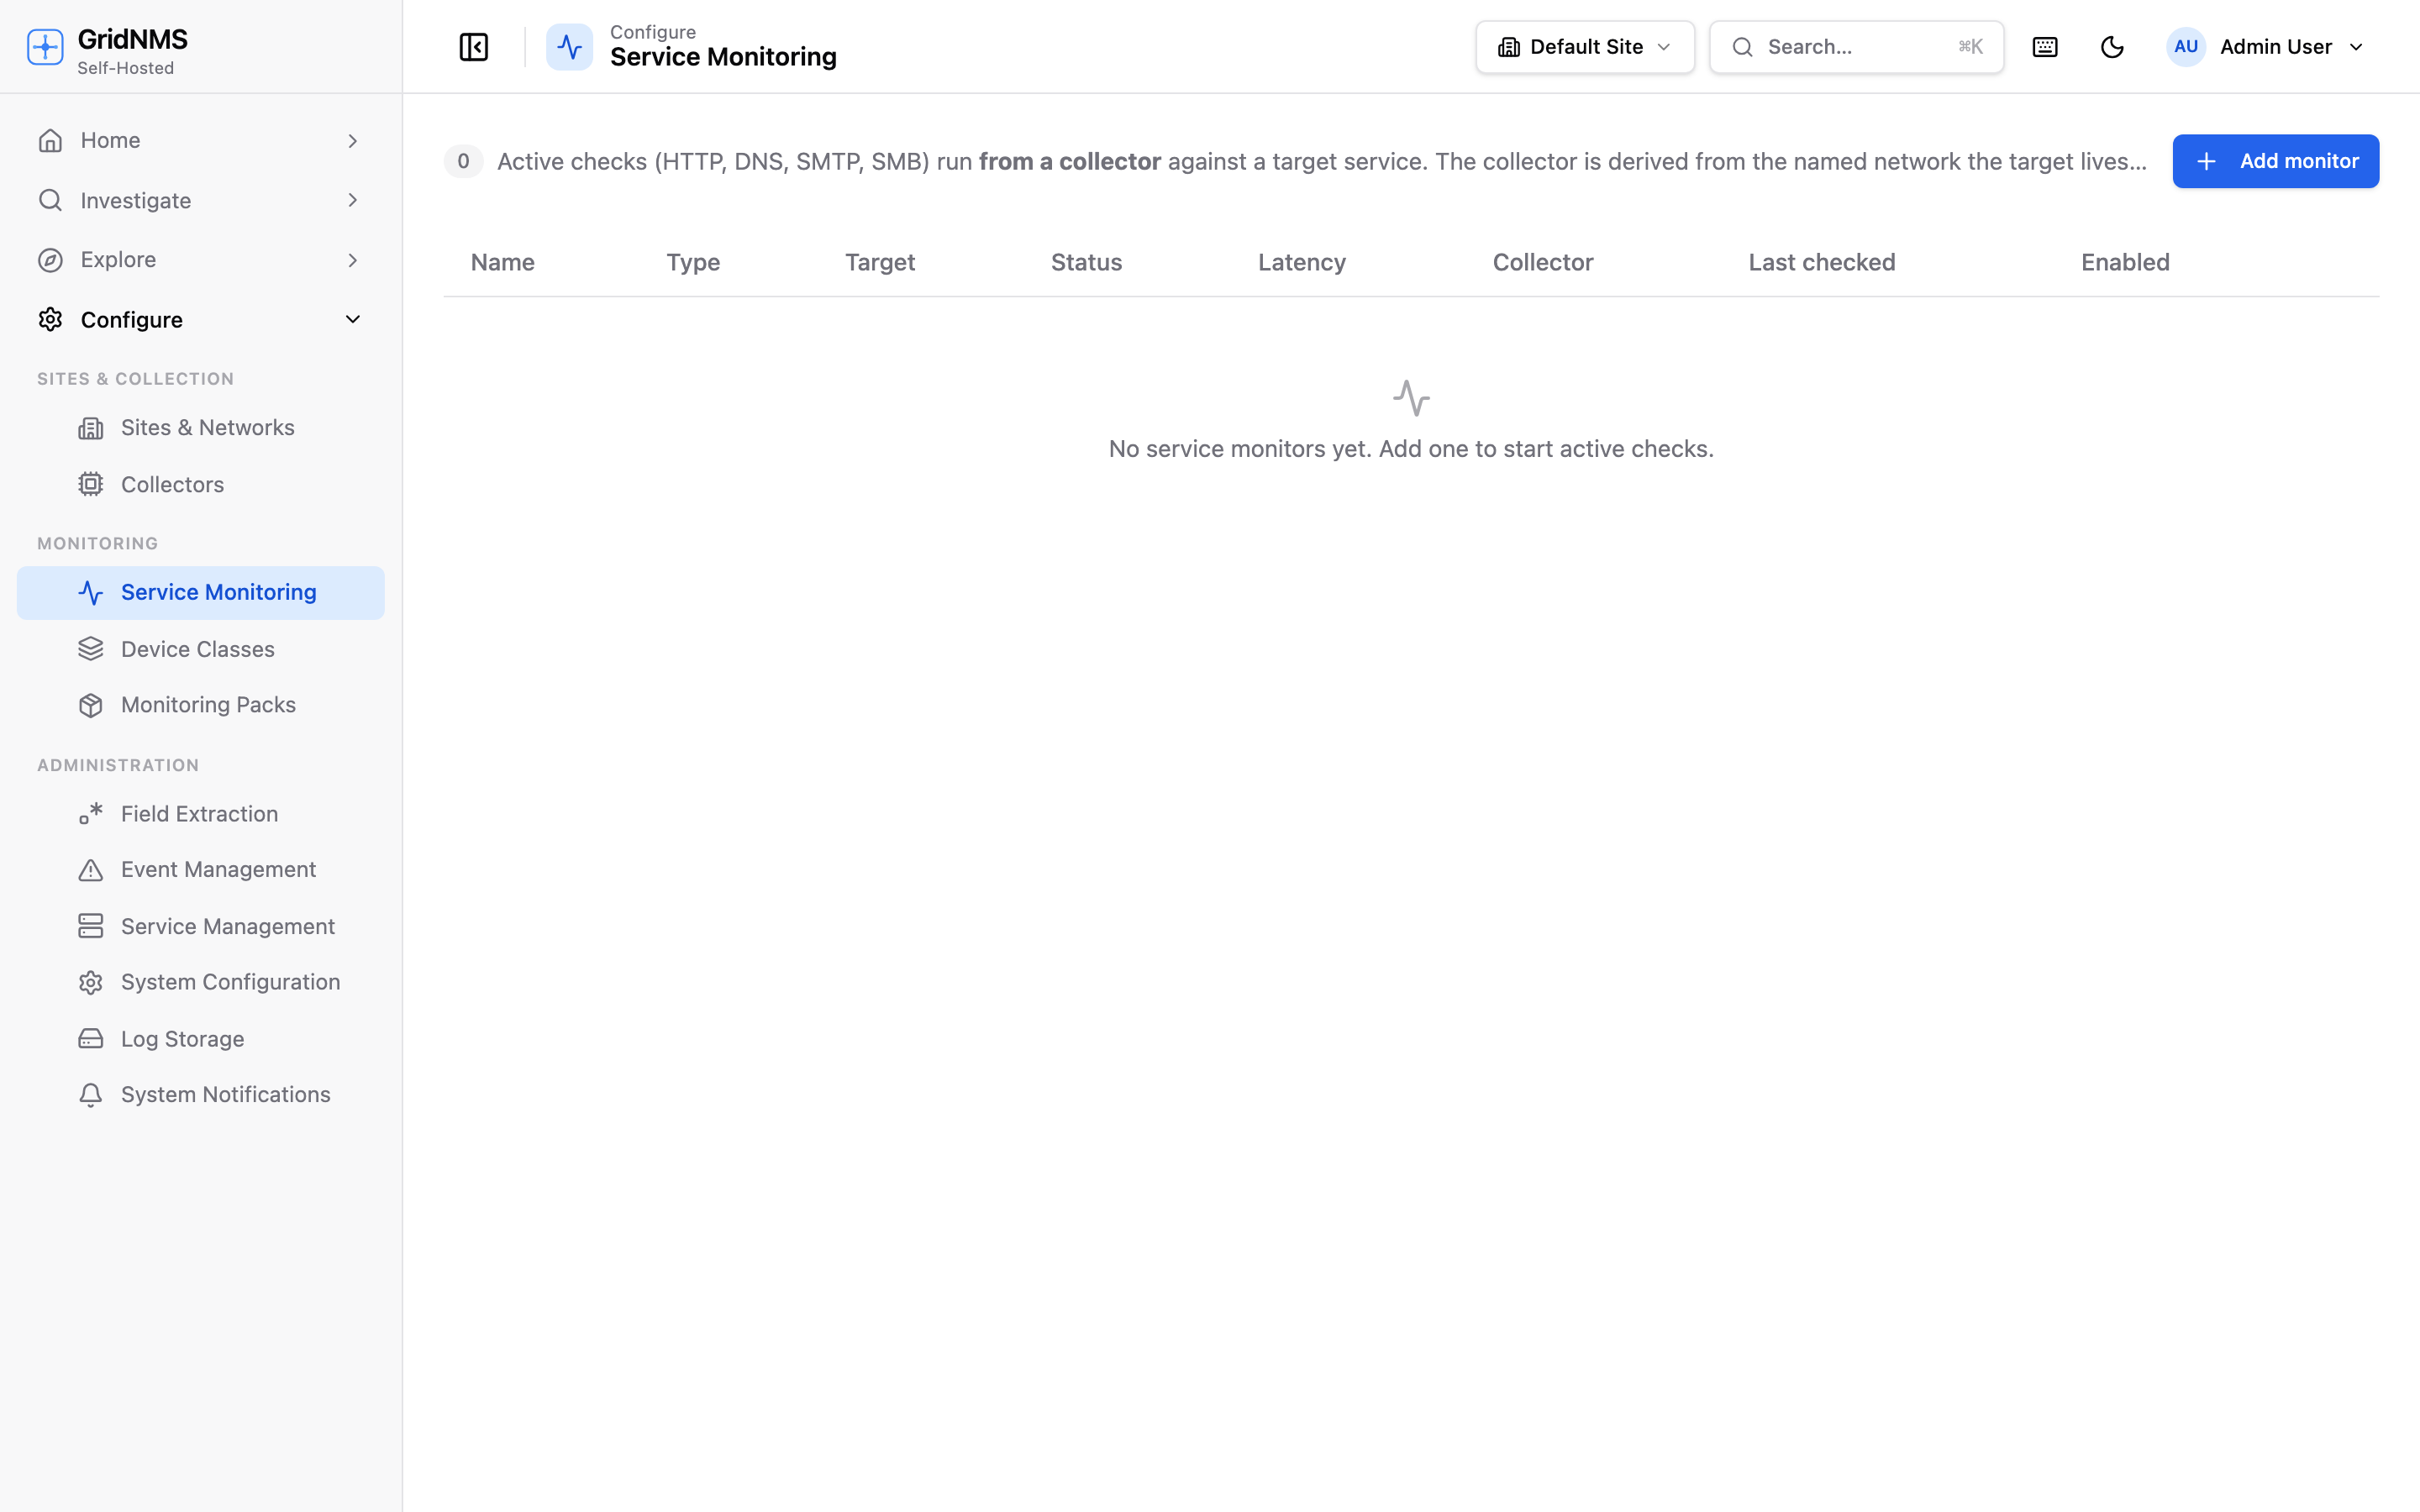 The Service Monitoring page lists each check with its type, target, current status, and latest response time.
How this differs from device reachability
Section titled “How this differs from device reachability”GridNMS already tells you whether a device is up — see Devices & Inventory. That check answers “is the box on the network?” Service Monitoring answers a different, more useful question:
| Device reachability | Service Monitoring | |
|---|---|---|
| What it checks | The device responds on the network | A specific service answers correctly |
| Example | The web server replies to a ping | https://app/health returns OK in under 500 ms |
| Catches | Hardware down, link cut, device offline | App crashed, port closed, cert/DNS broken, service slow |
Use both together: reachability for the device, a service check for each service that device exposes that you actually care about.
Where to find it
Section titled “Where to find it”Open Configure → Service Monitoring. The page shows every check you’ve created, one per row, with its type, target, current status, latency, the collector running it, and when it was last checked. The list refreshes on its own, so you can leave it open as a status board.
Creating a check
Section titled “Creating a check”Click Add monitor and fill in the dialog.
-
Name — a label you’ll recognize, e.g. Web app — login page.
-
Target — choose Manual host to type a hostname or IP, or Managed device to pick one of your existing devices from the list.
-
Check type — what kind of service you’re testing:
Type What it verifies HTTP A web endpoint responds. Optionally give a full URL (otherwise it’s built from the host) and a keyword that must appear in the response body. DNS A name resolves. Pick the record type (A, AAAA, CNAME, MX, TXT, NS). SMTP A mail server accepts a connection. SMB A Windows/file-sharing service answers. -
Collector — Service Monitoring runs each check from a collector, not from the GridNMS server, so the check is performed from inside the relevant network. GridNMS offers the collector(s) eligible to reach the target. If the target sits inside a named network, the matching collector is chosen automatically; otherwise pick which one runs it.
-
Port — leave as auto to use the default port for the check type, or set a specific one.
-
Interval (s) — how often the check runs (for example,
60for once a minute). Shorter intervals notice an outage sooner but run more often. -
Warn (ms) and Crit latency (ms) — optional response-time thresholds. Cross these and the check reports as degraded (warn) or contributes to a down/critical state, even when the service technically answered.
Click Create monitor. The first result appears after the next interval ticks.
Reading the results
Section titled “Reading the results”Each row shows a status and the latest latency:
| Status | Meaning |
|---|---|
| up | The service responded correctly within thresholds. |
| degraded | It responded, but slower than your Warn threshold. |
| down | It failed to respond, returned the wrong result, or the keyword was missing. |
| unknown | The check hasn’t run yet, or its collector is offline. |
Latency is the round-trip time of the last check, in milliseconds — a steady number means a healthy service; a rising trend is an early warning that something is getting slower before it breaks.
The detail view
Section titled “The detail view”Click any row to open its detail panel. You get the full configuration at a glance plus a latency chart over a time range you choose, so you can see how response time has trended — useful for spotting a service that’s been slowly degrading or for confirming an outage window. The Last error field shows why the most recent check failed, if it did.
Editing and disabling a check
Section titled “Editing and disabling a check”- Use the pencil icon on a row to edit it. You can change the name, interval, thresholds, severity, HTTP/DNS options, and which collector runs it. The target and check type are fixed — to change those, delete the check and create a new one.
- Use the Enabled toggle to pause a check without deleting it — handy during planned maintenance so you don’t get alerted for an outage you already know about.
- Use the trash icon to remove a check entirely.
Getting alerted when a check fails
Section titled “Getting alerted when a check fails”A failing check raises an event in GridNMS, exactly like any other alert. When you create or edit a check you set its down-event severity (Critical, Major, Minor, Warning, or Info), which controls how prominently the failure shows up.
From there it flows through your alerting like everything else: the event appears on the Events & Alerts page and is delivered to the right people through your Notifications setup. So you can, for example, have a critical web-app check page on-call while a minor internal check only sends email.
Where to go next
Section titled “Where to go next”- Decide who gets told, and how, in Notifications.
- Triage the failures these checks raise on Events & Alerts.
- Understand the difference between device and service health in Devices & Inventory.