Telemetry Pipeline
Your devices send GridNMS a steady stream of data — interface counters, status values, inventory details, and more. The Telemetry Pipeline is the view that shows how that stream is handled: which data points GridNMS recognises and stores, and which ones arrive that it doesn’t yet know what to do with. That second group is the useful part — it’s a live list of data your devices are offering that GridNMS isn’t capturing yet, which tells you exactly where there’s room to monitor more.
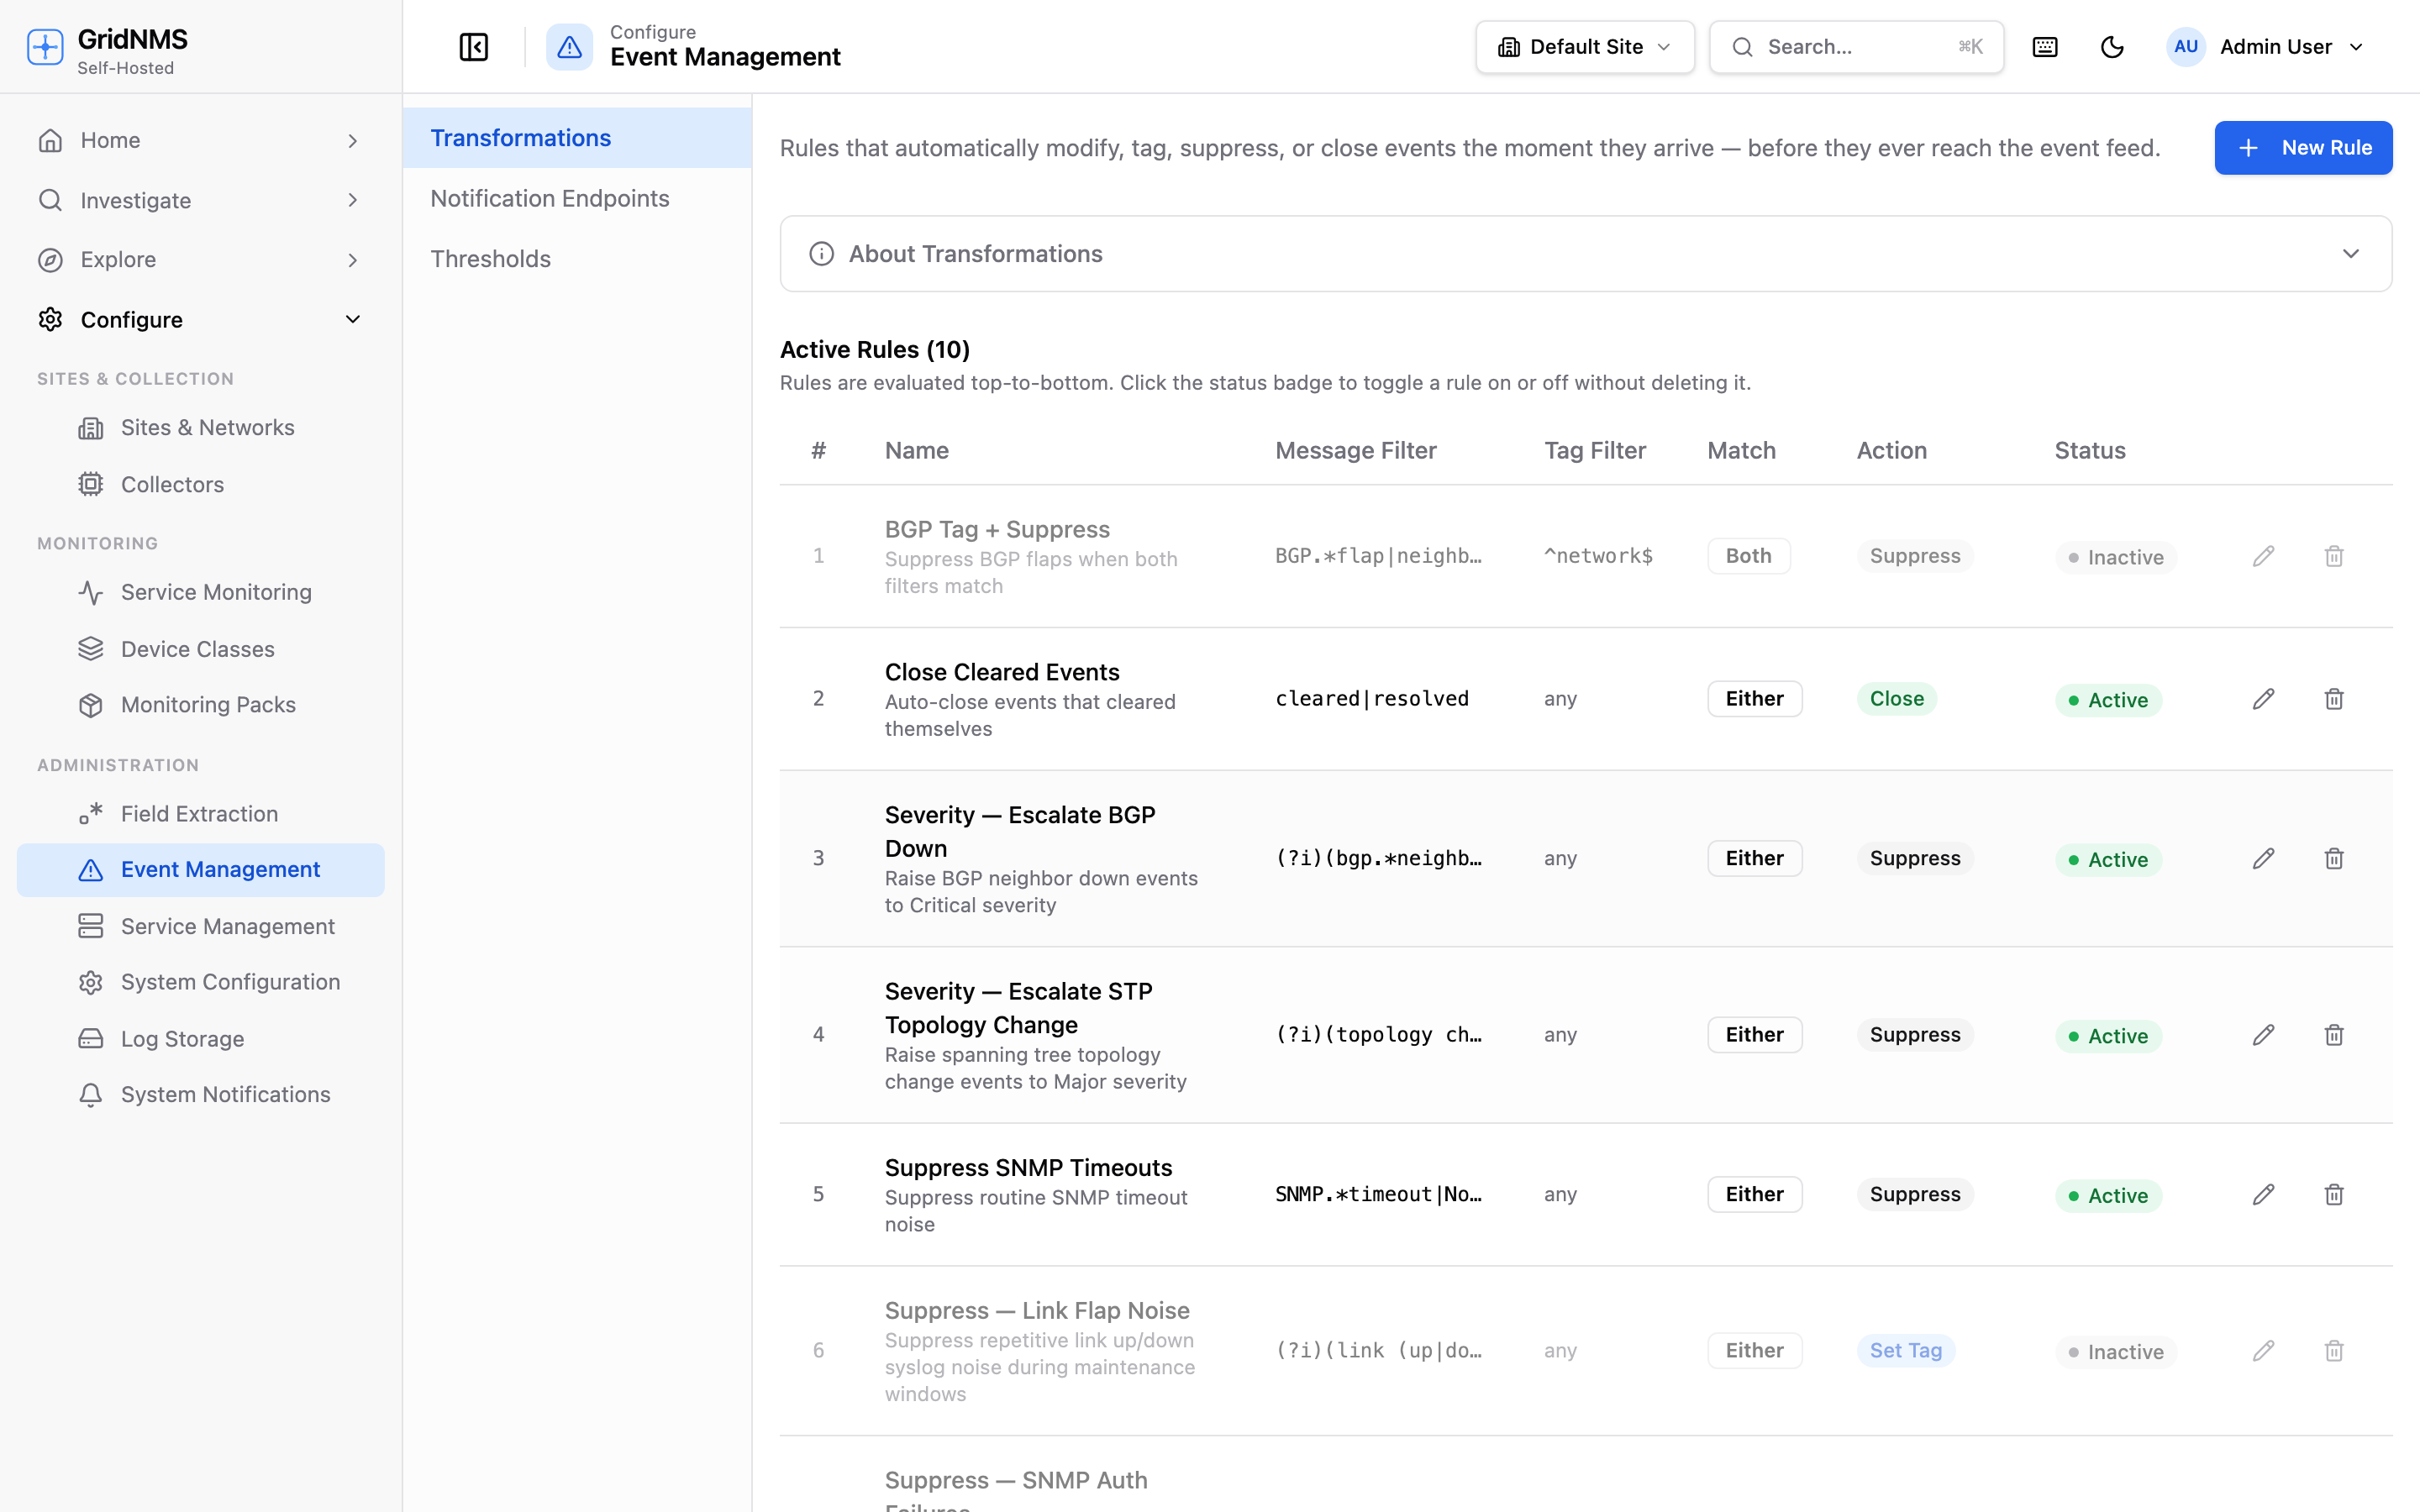
Open it from Configure → Event Management → Telemetry Pipeline.
 The Telemetry Pipeline shows recognised data points and a queue of data arriving that GridNMS doesn’t yet have a mapping for.
Two views: recognised and unmapped
Section titled “Two views: recognised and unmapped”The page has two tabs:
- Field Registry — every data point GridNMS already recognises, and where it routes that data. Think of this as the master list of “things we know how to store.”
- Unmapped Queue — data points that have arrived from your devices but don’t match anything in the registry yet. Each one carries a count of how often it’s been seen and a sample of its value.
A badge on the Unmapped Queue tab shows how many unrecognised data points are currently waiting — a quick signal that there’s device data going uncaptured.
The Field Registry
Section titled “The Field Registry”The registry lists each known data point with:
| Column | Meaning |
|---|---|
| Field Path | The internal name of the data point as it arrives from the device. |
| Label | A friendly, human-readable name. |
| Destination | Where the data goes once recognised (see below). |
| Handler / Config | The specific rule applied to it. |
A small lock icon next to a label marks a built-in data point that GridNMS ships with. These are core to how the product works and can’t be edited or removed — only your own custom entries can be changed.
Where recognised data goes
Section titled “Where recognised data goes”Each entry’s Destination tells you how GridNMS treats that data point:
- Built-in — handled by GridNMS’s standard processing and stored as part of your normal monitoring data.
- Graph node — turned into an item on your network map and linked to the device it came from (useful for things like running processes or containers that you want to see related to a device).
- Discard — deliberately ignored. You’ve told GridNMS this data point isn’t worth storing, so it’s dropped on arrival.
The Unmapped Queue
Section titled “The Unmapped Queue”This is the most valuable part of the page for day-to-day administration. When a device sends a data point GridNMS doesn’t recognise, instead of silently dropping it, GridNMS parks it here so you can decide what to do. Each row shows:
| Column | Meaning |
|---|---|
| Field Path | The unrecognised data point’s name. |
| Occurrences | How many times it’s been seen — high counts mean it arrives constantly. |
| Last Seen | When it most recently arrived. |
| Sample Value | An example of the actual value, so you can tell what it is. |
High occurrence counts are a strong hint: a data point arriving thousands of times is something your devices report routinely, and capturing it could be worth the effort.
Acting on unmapped data
Section titled “Acting on unmapped data”For each unmapped data point you have two choices:
- Map this — start capturing it. This opens a short form, pre-filled from the sample, where you give the data point a friendly label and choose how it should be stored. Once saved, future arrivals are recognised and routed instead of queued.
- Discard — tell GridNMS to silently drop this data point from now on. Use this for noise you’re sure you’ll never want, so it stops cluttering the queue.
Deciding what to do with what you find
Section titled “Deciding what to do with what you find”The Unmapped Queue is really a planning tool. When you spot device data here that you’d like to monitor, you have a few paths:
- The data fits a kind of device you manage. The cleanest way to capture data from a whole category of devices is a monitoring pack, which bundles up what to collect and how to show it for a class of devices. See Monitoring Packs to understand how packs work and whether one already covers what you’re seeing.
- There’s no pack for it yet, and you want to build one. If the data comes from equipment GridNMS doesn’t have built-in coverage for, you can capture the device details needed and create your own pack. See Building a Monitoring Pack, which also explains how to submit the underlying device data so coverage can be improved.
- It’s a one-off you want on the map. Map it directly here as a graph node so it shows up linked to its device, without building a whole pack.
A typical workflow
Section titled “A typical workflow”- Open the Unmapped Queue and sort your attention by Occurrences — the data points arriving most often are usually the most worthwhile.
- Check the Sample Value to understand what each one actually is.
- Decide: is this something a whole class of your devices reports? If so, a monitoring pack is the durable answer.
- For noise you’ll never want, Discard it to keep the queue clean.
- Revisit periodically — as you add devices, new unmapped data points will appear, and the queue stays a useful map of untapped monitoring opportunities.
Where to go next
Section titled “Where to go next”- Monitoring Packs — bundle up what to collect and how to display it for a class of devices.
- Building a Monitoring Pack — create your own coverage and submit device data for data points GridNMS doesn’t recognise yet.
- Poller Queue — watch the on-demand polls that fetch data from your devices.