Collector Channels
Every collector keeps a small set of outbound connections open to GridNMS. We call these channels. Each channel carries a different kind of traffic, and each one reports its own health so you can tell at a glance whether configuration is flowing, whether logs are keeping up, and whether anything is backing up.
You’ll find them under Configure → Collectors. Open a collector from the list, then select the Channels tab.
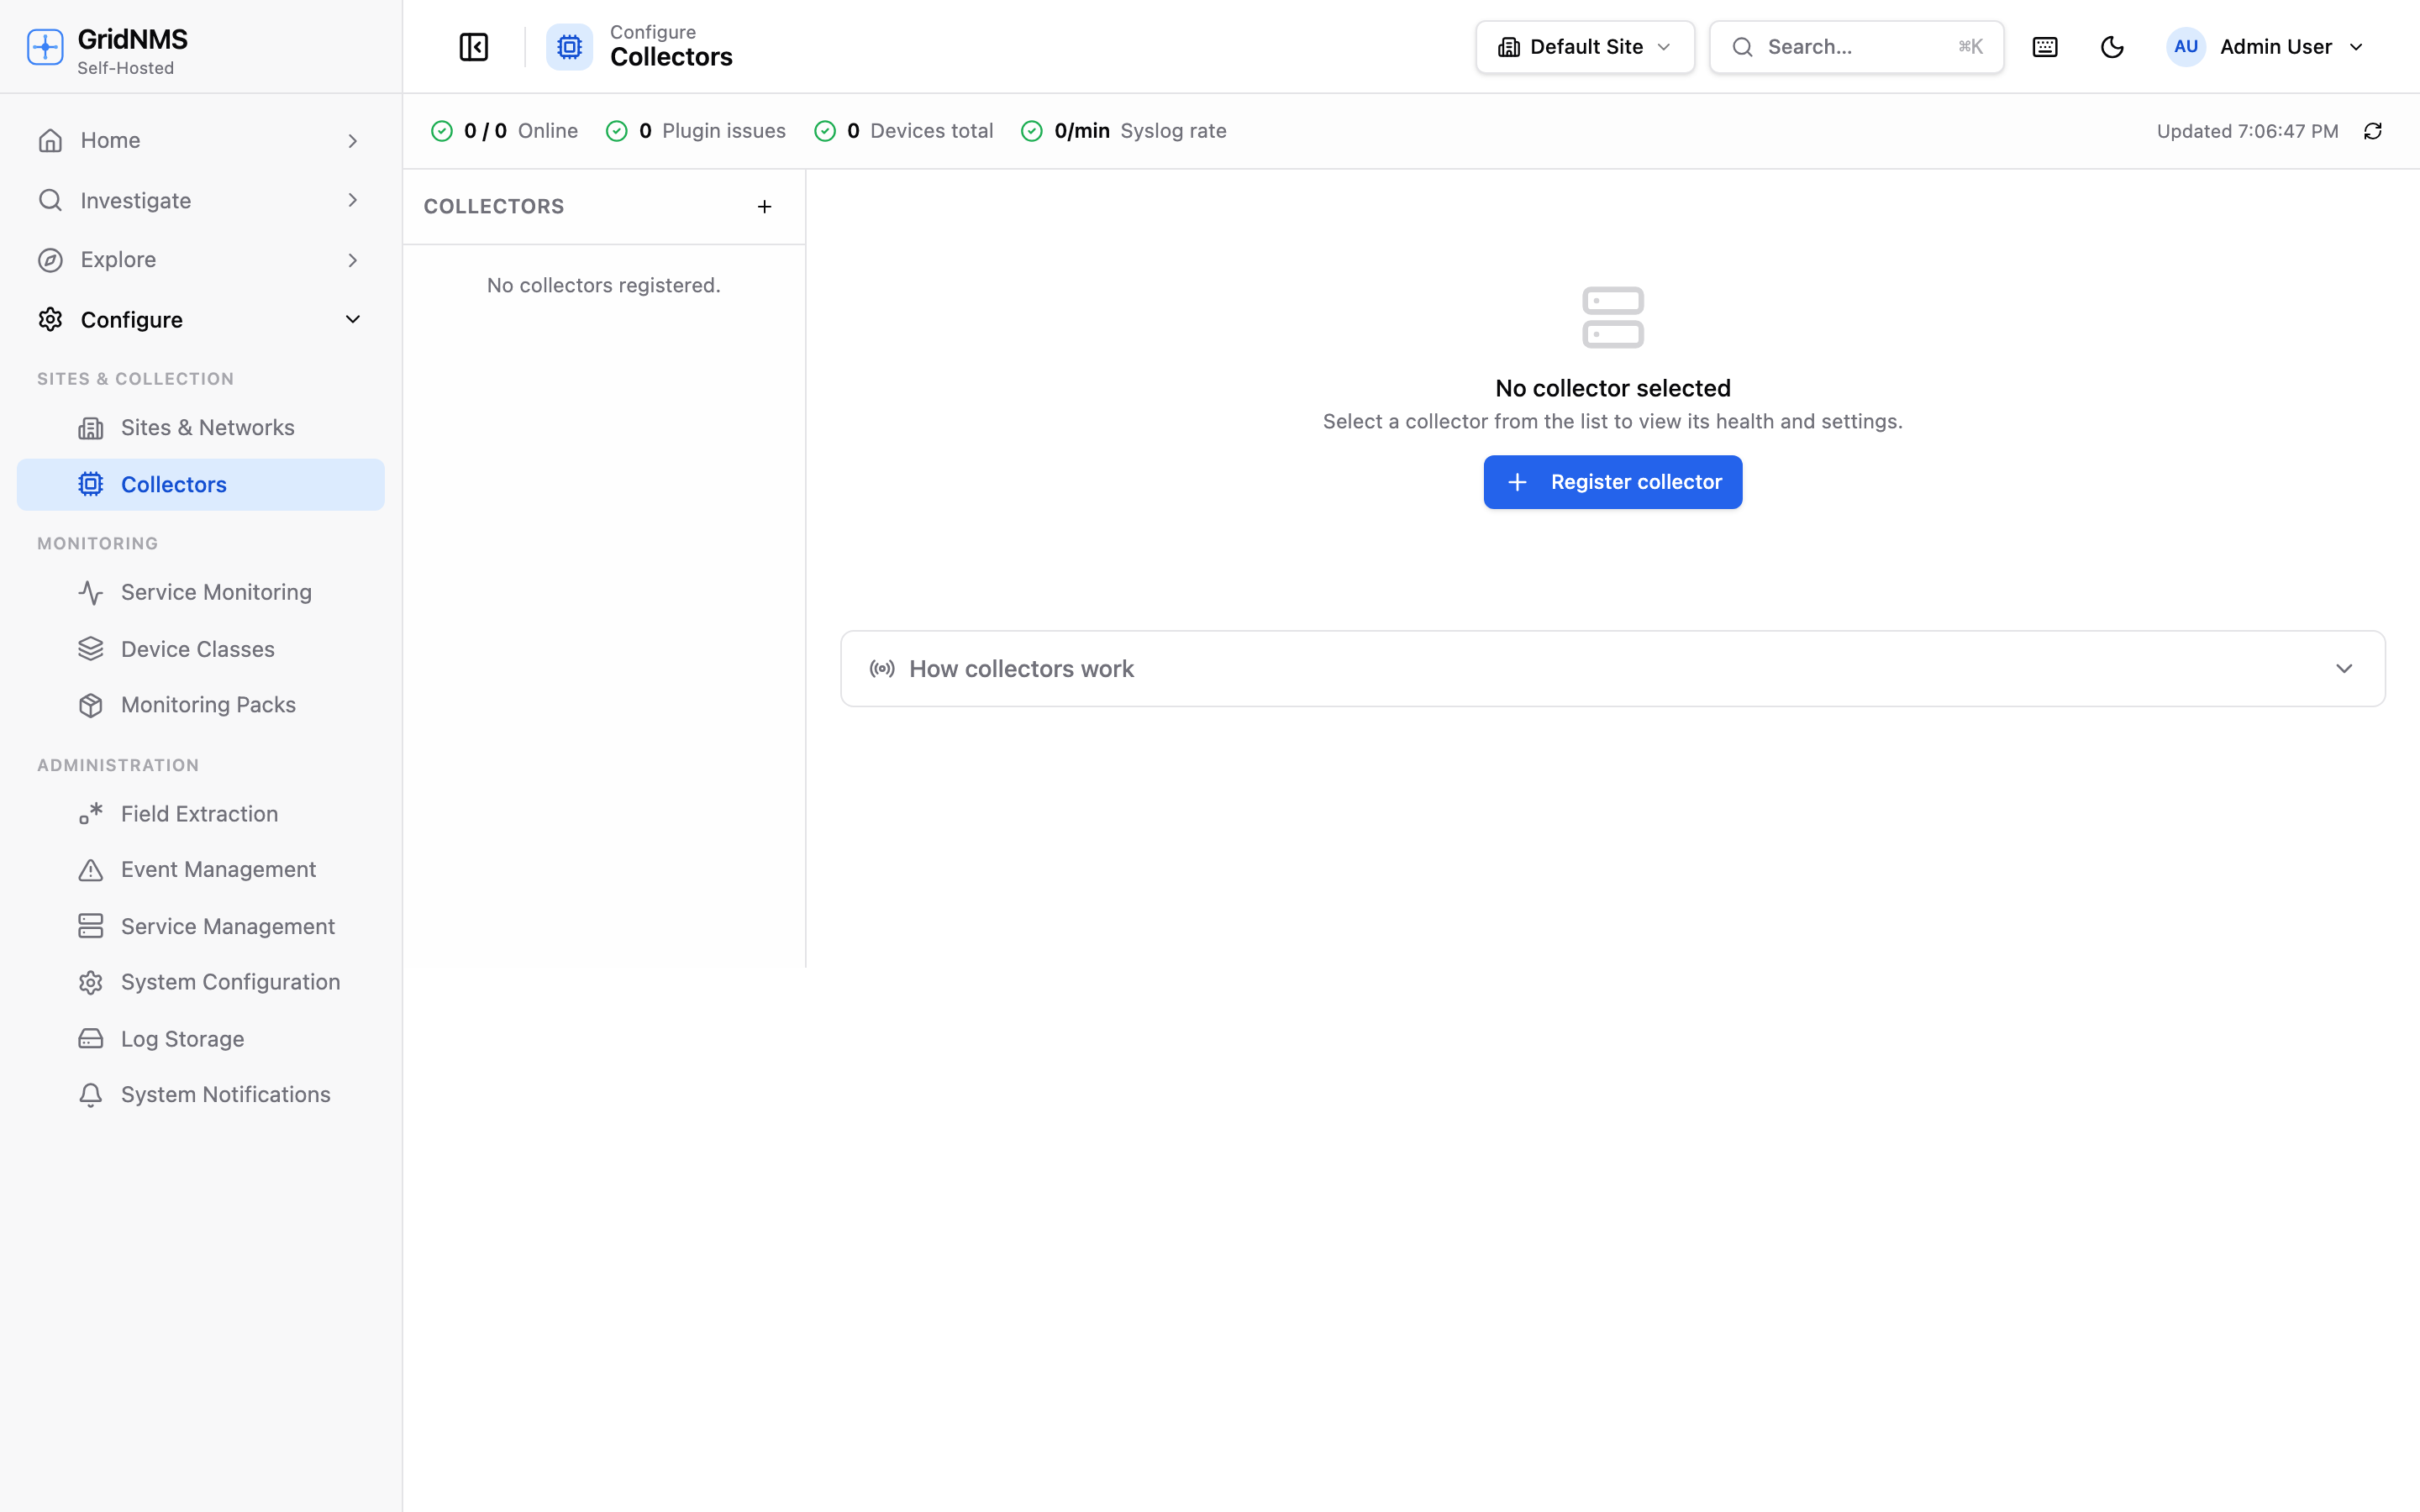
The Collectors page. Open a collector and select the Channels tab to see per-channel health.
The three channels
Section titled “The three channels”| Channel | What it carries | Always on? |
|---|---|---|
| Control channel | Configuration, work dispatch (which devices to poll), and health metrics | Yes |
| Logging channel | A high-volume stream of received syslog messages and SNMP traps, shipped up to GridNMS | When the collector is receiving logs |
| Telemetry channel | Reserved for a future use | Not yet active |
Control channel
Section titled “Control channel”The control channel is the always-on, secure connection between the collector and GridNMS. It is how the collector:
- Receives its configuration — which networks it’s responsible for, which devices to poll, and which features are enabled.
- Receives work to do, such as on-demand polls and discovery requests.
- Sends back its health heartbeat every minute.
If the control channel is down, the collector is effectively offline: it stops receiving new instructions and stops reporting in. This is the most important channel to keep healthy.
Logging channel
Section titled “Logging channel”The logging channel is a separate, high-volume stream dedicated to the logs and traps your devices send. When a device sends a syslog message or an SNMP trap to the collector, the collector batches those events and ships them up over this channel so they show up in GridNMS for searching and alerting.
Keeping logs on their own channel means a sudden burst of log traffic — say, a device flapping and generating thousands of messages a minute — never starves the control channel. Configuration and health keep working even under heavy log load.
Telemetry channel
Section titled “Telemetry channel”The telemetry channel is reserved for future use. You may see it listed, but it isn’t carrying traffic yet — there’s nothing to configure and nothing to act on.
Reading channel health
Section titled “Reading channel health”Each channel shows a status pill and a grid of live statistics. The collector refreshes these figures continuously while it’s connected.
Status pill
Section titled “Status pill”| Status | Meaning |
|---|---|
| Healthy | The channel is connected and flowing normally. |
| Idle | The channel is up but has no traffic right now (for example, no logs are arriving). This is normal and not a problem. |
| Degraded | The channel is working but something is off — messages are being retried, latency is high, or a buffer is filling. Worth a look. |
| Down | The channel is not connected. Traffic on this channel is stalled. |
| Disabled | The channel is turned off and not in use. |
What the statistics mean
Section titled “What the statistics mean”The Producer section is the collector’s view — what it is sending:
| Statistic | What it tells you |
|---|---|
| Events/sec | How many events the collector is currently sending on this channel. |
| Throughput | The data rate (bytes per second) the collector is pushing. |
| Buffer depth | How many events are waiting in the collector’s local buffer to be sent. Zero is ideal. A small, brief number during a burst is fine; a number that keeps climbing means the channel can’t keep up. |
| Backpressure | Shows when GridNMS is asking the collector to slow down because it’s receiving faster than it can accept. Occasional backpressure is normal under load; constant backpressure points to a bottleneck. |
| Latency p50 / p99 | How long sends are taking — the typical case (p50) and the slow tail (p99). High p99 latency is an early sign of a strained channel. |
| Retries | How many sends had to be re-attempted. A few is normal; a steady stream suggests an unstable connection. |
| Drops | Events that were discarded rather than sent — usually because a buffer filled past its limit. Any sustained drops mean you’re losing data and should investigate. |
| 429s | How many times GridNMS told the collector to back off. Tracks closely with backpressure. |
| Last success | When the channel last sent successfully. “Just now” or a few seconds is healthy; minutes ago on an active channel is a warning sign. |
| Up | How long the channel has been continuously connected. |
| Snapshot | When these figures were last refreshed. If this goes stale, the collector may be struggling to report in. |
For the logging channel only, a second Receiver section shows GridNMS’s view — what it is actually accepting:
| Statistic | What it tells you |
|---|---|
| Accepted/sec | Events GridNMS is accepting per second. Compare with the producer’s Events/sec — they should track closely. |
| Throughput | The data rate GridNMS is receiving. |
| Ingest p50 / p99 | How long GridNMS is taking to accept each batch. |
| Accepted | Total events accepted. |
| Rejected | Events GridNMS refused (for example, malformed). Any sustained rejects are worth investigating. |
| Deduped | Duplicate events GridNMS recognised and collapsed — normal and healthy; it prevents double-counting if a batch is re-sent. |
| Last seen | When GridNMS last received from this collector. |
What to do when a channel isn’t healthy
Section titled “What to do when a channel isn’t healthy”- Control channel Down — the collector can’t reach GridNMS. Check the collector’s network path and that it’s running. The collector reconnects on its own once connectivity returns.
- Logging channel Degraded or backing up — usually a traffic spike. Watch the buffer depth: if it drains back to zero on its own, the burst has passed. If it keeps climbing or you see drops, the collector may be undersized for the log volume it’s handling.
- Any channel stuck Idle when you expect traffic — confirm the source is actually sending. For logs, verify your devices are pointed at the collector on the right port (see Receiving Logs & Traps).
Related pages
Section titled “Related pages”- Receiving Logs & Traps — how devices send logs and traps to a collector.
- Monitoring & Managing Collectors — fleet-wide health and first steps when something’s wrong.
- Logs & Log Search — find and search the logs once they arrive.