Working with Interfaces
Every device GridNMS monitors has a list of interfaces — physical ports, virtual interfaces, sub-interfaces, and tunnels. GridNMS discovers them automatically and collects traffic, packet, and error data for each one. But not every interface is worth watching: management loopbacks, unused ports, and chatty virtual interfaces can clutter your charts and inflate your stored data for no benefit.
This page covers how to curate the interface list on a device — showing and hiding interfaces, tidying up the noise, and setting bandwidth thresholds so a saturated link raises an alert before users start complaining.
 The device detail page. The Interfaces tab lists every discovered interface with its description, VLAN, status, and a live traffic sparkline.
Finding the interface list
Section titled “Finding the interface list”Open any device from Devices, then select the Interfaces tab on the device detail page. You’ll see a table with one row per interface:
| Column | What it shows |
|---|---|
| Name | The interface name as the device reports it (e.g. GigabitEthernet1/0/1). |
| Description | The interface description configured on the device, or one you’ve set yourself. |
| VLAN / Voice VLAN | The access VLAN and voice VLAN, when the device reports them. |
| Cable / Location | Optional cabling and physical-location notes you can fill in. |
| Status | Up or Down, based on the most recent state change. |
| Chart | A live sparkline of recent traffic. Click it to open the full bandwidth chart. |
Use the search box above the table to filter by name, description, cable, location, or VLAN. This is the fastest way to jump to a specific port on a high-port-count switch.
Showing and hiding interfaces
Section titled “Showing and hiding interfaces”Hiding an interface removes it from the table and from your charts so you can focus on the ports that matter. Each interface row has an eye icon in the last column:
- A solid eye icon means the interface is currently hidden — click it to unhide.
- A crossed-out eye-off icon means the interface is visible — click it to hide.
When interfaces are hidden, a Show hidden interfaces (N) button appears next to the search box. Click it to reveal the hidden rows (they show dimmed); click it again to collapse them back out of view.
This behavior is deliberate and useful: hiding the dozens of unused access ports on an access switch both declutters the view and trims the amount of data GridNMS stores and processes. The trade-off is that you get no history for a hidden interface, so only hide ports you genuinely don’t need to watch.
When to hide an interface
Section titled “When to hide an interface”- Unused access ports with nothing plugged in.
- Management or loopback interfaces that never carry user traffic.
- Noisy virtual interfaces (for example, large numbers of per-client wireless interfaces) that overwhelm the chart picker.
When to keep an interface visible
Section titled “When to keep an interface visible”- Uplinks and trunks — these are the links you most want to watch for saturation.
- Anything you’ve set a threshold on — a hidden interface collects no data, so its thresholds can never fire.
Broader hide rules (interface ignore overrides)
Section titled “Broader hide rules (interface ignore overrides)”The eye icon hides one interface at a time. If you want to hide a whole family of interfaces by name — say, every per-client wireless interface — you can use a pattern-based rule instead. Scroll to the Interface Ignore Overrides section further down the device detail page.
There you can add a name pattern and choose an action:
- ignore — interfaces whose name matches the pattern stop collecting metrics and are hidden (the same effect as the eye icon, but applied to every matching name now and in the future).
- allow — re-includes a name that a broader ignore rule would otherwise hide. Use this to carve out exceptions.
Rules can be inherited from the device’s class or from its monitoring pack, and a device-level rule always takes precedence over an inherited one. The panel shows you the full picture: what’s inherited, what’s set on the class, and what’s set on this specific device. New rules take effect within about a minute.
Editing interface details
Section titled “Editing interface details”Click the pencil icon on any interface row to open its editor. The Info tab lets you set fields that GridNMS can’t always learn automatically:
| Field | Use it for |
|---|---|
| Description | A friendly description if the device doesn’t supply one. |
| VLAN / Voice VLAN | Record the data and voice VLANs for documentation. |
| Comment | A free-text note for your team (e.g. “patches to rack B, panel 3”). |
Click Save to apply. These values are yours and persist across re-discovery.
The Charts tab in the same editor gives you the full-size Bandwidth chart and the Thresholds view described below.
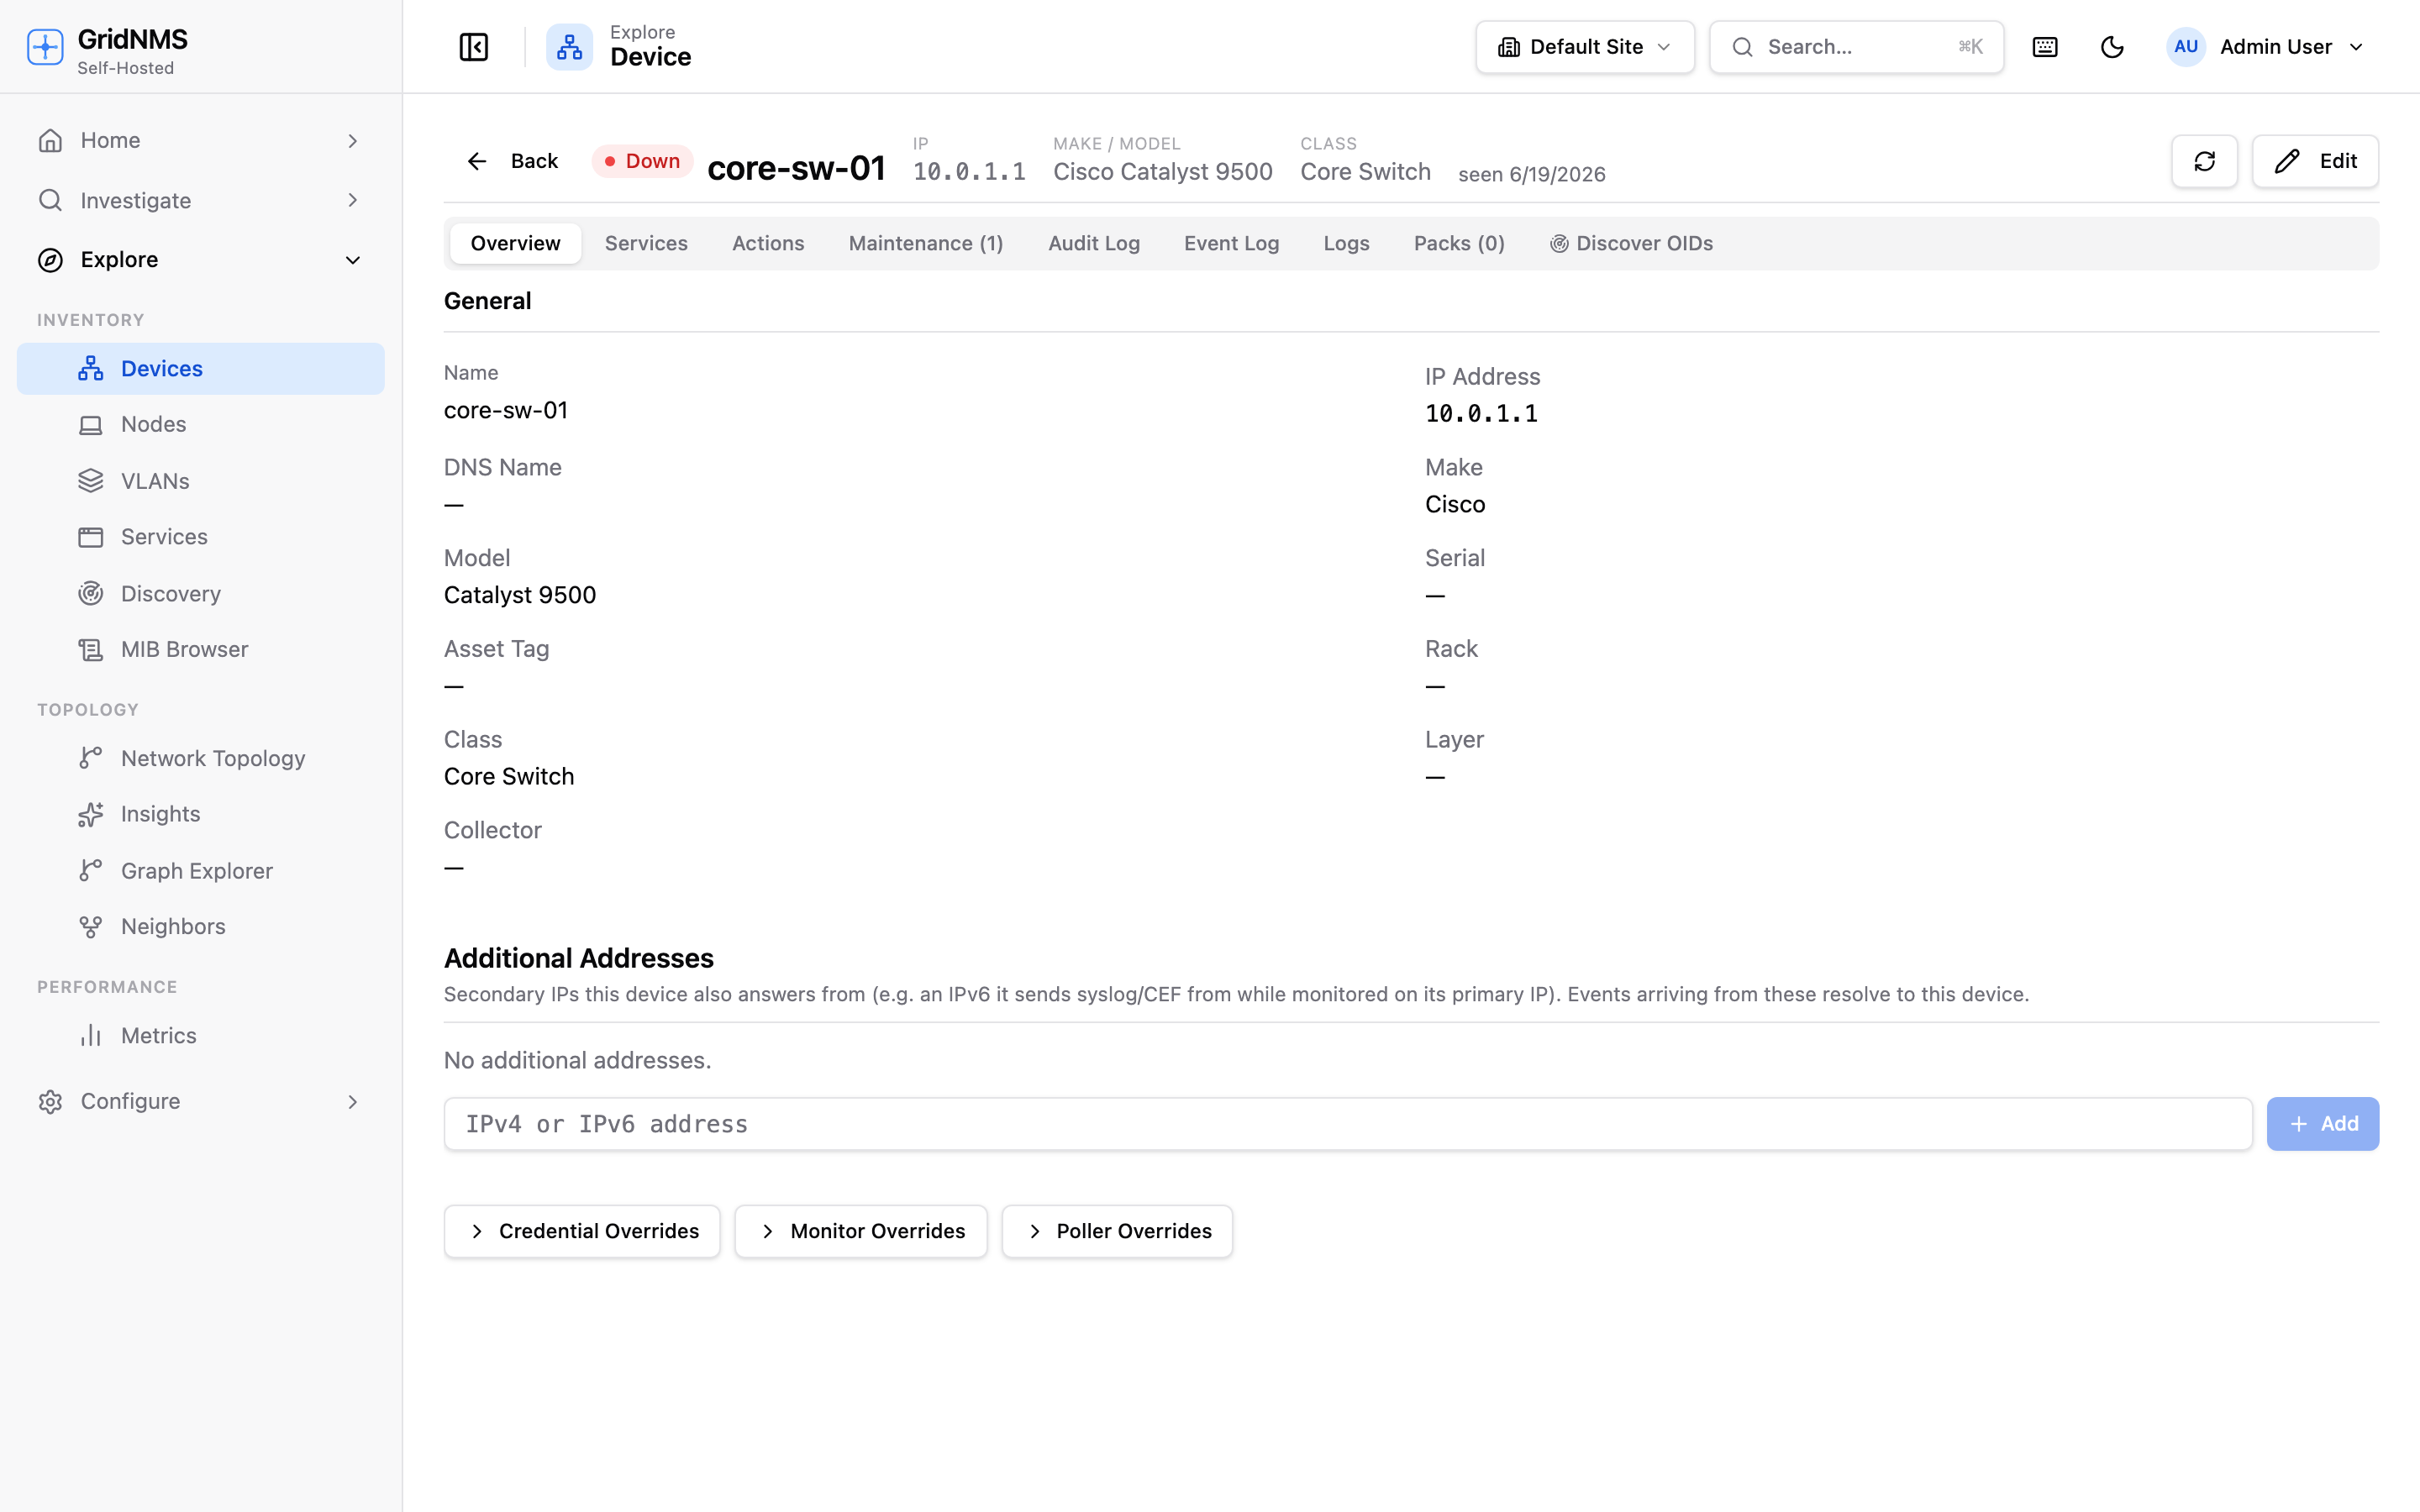
Additional addresses on a device
Section titled “Additional addresses on a device”Interfaces themselves are discovered automatically — you don’t add them by hand. But a device often answers on more than one IP address (a management address, a loopback, a secondary subnet). GridNMS lets you record these so the device is recognised no matter which address traffic, syslog, or traps arrive from.
On the device detail page, use Additional Addresses → Add to attach extra IPs to the device. Once added:
- Syslog and SNMP traps arriving from any of those addresses are attributed to this device — not logged as coming from an unknown sender.
- The device is matched on any of its addresses during discovery and lookups.
Per-interface bandwidth thresholds
Section titled “Per-interface bandwidth thresholds”A threshold turns a traffic reading into an alert. When an interface’s inbound or outbound traffic crosses a level you set, GridNMS raises an event — and, if you’ve configured delivery, sends a notification.
To add one:
- On the Interfaces tab, click an interface’s sparkline (or open the editor and go to Charts).
- Switch to the Thresholds view.
- Click New Threshold and fill in the dialog:
| Setting | What it means |
|---|---|
| Name | A label for the alarm, e.g. High inbound utilisation. Required. |
| Direction | Inbound or Outbound traffic. |
| Condition | Greater than, at least, less than, or at most. |
| Value | The level to compare against, entered as a rate — e.g. 50Mbps, 1Gbps. Required. |
| Severity | How serious a breach is, from Critical down to Debug. |
| Custom Message | Optional. Auto-generated from the rule if left blank. |
| Notification Endpoint | Where to send the alert (email, chat, webhook, etc.), or None. |
| Also email me | Sends the alert to you, the rule’s creator, in addition to the endpoint. |
| Active | Turn the threshold on or off without deleting it. |
Click Save. Once active, the threshold appears as a reference line on the bandwidth chart, so you can see at a glance how close the interface is running to its limit.
Editing and removing thresholds
Section titled “Editing and removing thresholds”The Thresholds view lists every threshold on the interface. Each row shows its direction, condition, value, severity, and whether it’s currently active. Use the controls on each row to edit or delete a threshold. Deleting a threshold removes its alarm immediately; deactivating one keeps the definition but stops it firing.
Seeing all thresholds at once
Section titled “Seeing all thresholds at once”Per-interface thresholds across every device are also listed in one place under Threshold Alarms in the admin area. That page shows each alarm’s current state (OK or Breaching), severity, the device and interface it belongs to, its notification settings, and when it last breached. It’s the best view for auditing your alerting at a glance. See Understanding Your Metrics for how thresholds translate readings into alerts, and Events & Alerts for what happens after one fires.
Related pages
Section titled “Related pages”- Understanding Your Metrics — what each reading means and when it signals a problem.
- Overriding Device Details — set your own values for fields GridNMS gathered over SNMP.
- Devices & Inventory — browsing and organizing the device list.
- Events & Alerts — triaging the events that thresholds raise.