Understanding Your Metrics
GridNMS collects a lot of numbers. Traffic rates, error counts, response times, CPU, memory, disk — for dozens or hundreds of devices, all the time. The value of all that data is only realized when you can look at a chart and answer three questions: what does this mean, is it a problem, and what do I do about it?
This page is a practical, vendor-neutral guide to the metrics GridNMS shows you. It walks through each common area, what a healthy reading looks like, what a concerning one looks like, and the first action to take. None of it requires deep expertise — just enough context to act with confidence.
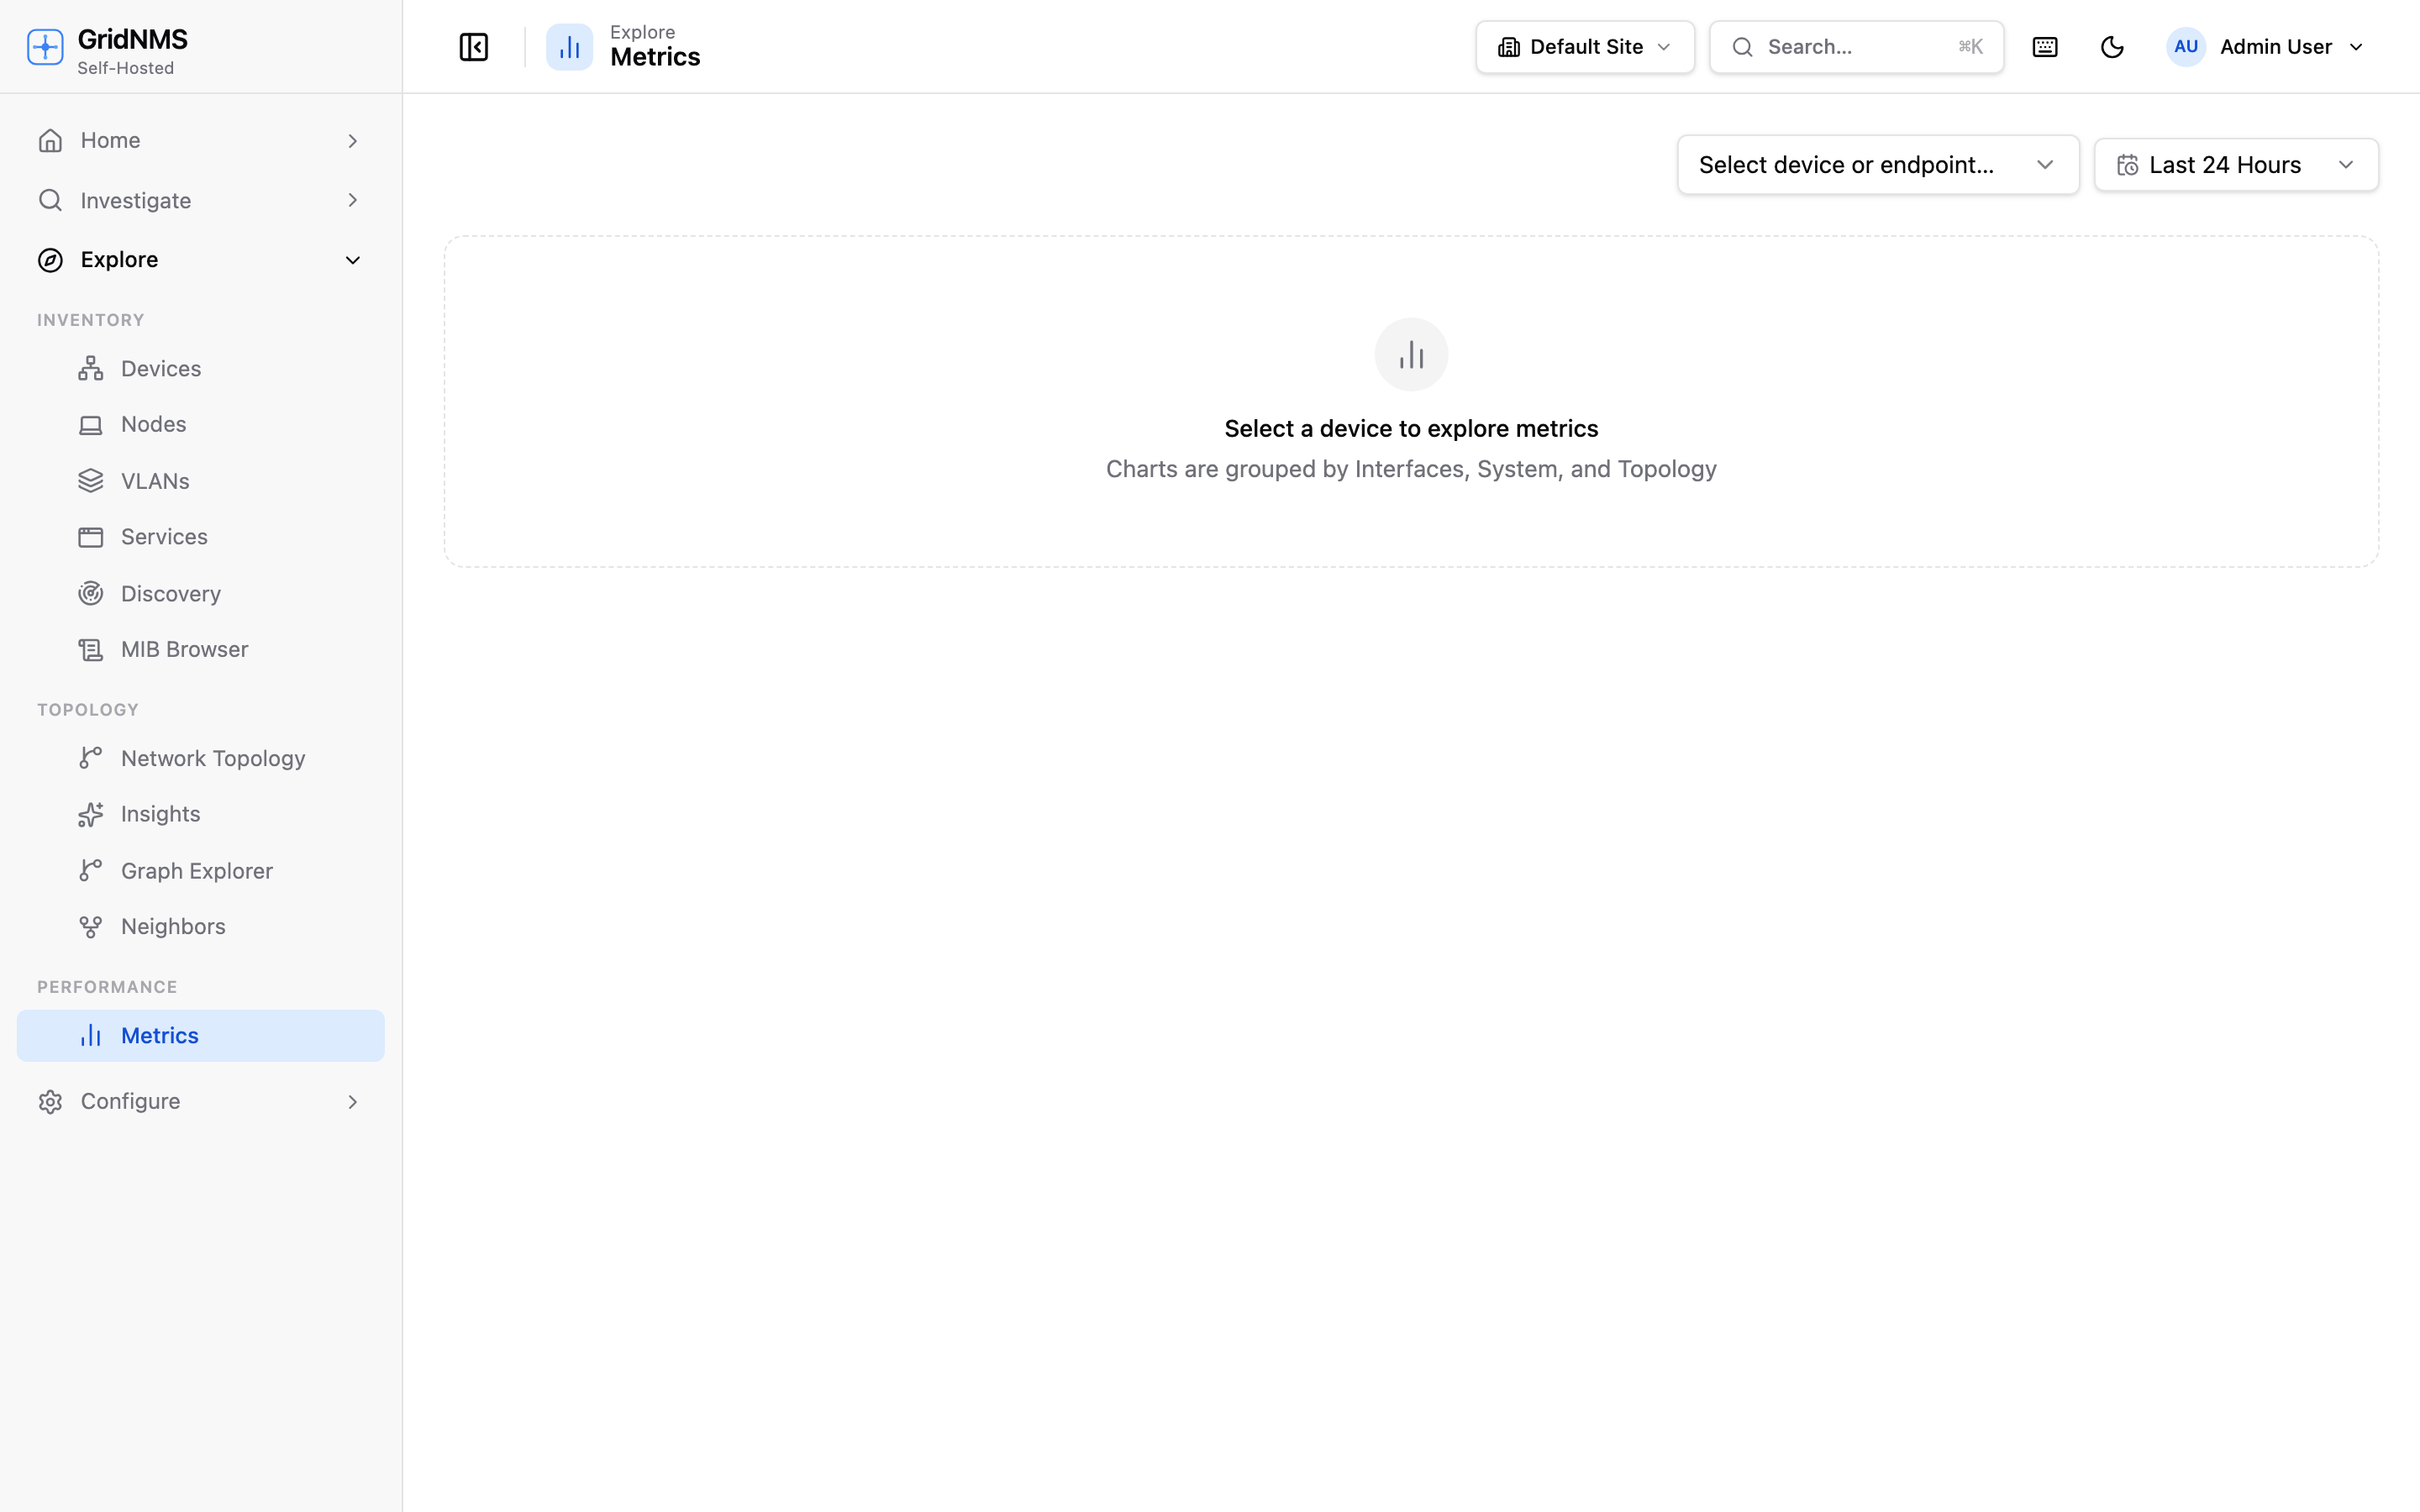 The Metrics page. Pick a device, pick the interfaces or system metrics you care about, choose a time range, and read the charts.
How to read the charts
Section titled “How to read the charts”Open Metrics, choose a device from the picker, and pick a time range in the top-right. Charts are grouped into sections:
- Interfaces — per-port traffic, packets, and errors. Select one or more interfaces to chart them.
- System — device-wide health like CPU, memory, disk, and uptime.
- Topology & Neighbors — discovered tables of neighbors, ARP, MAC, and routing peers.
The time range matters. A spike that looks alarming on a 1-hour view often disappears into normal daily rhythm on a 7-day view. When something looks off, widen the range to see whether it’s a blip or a trend.
Interface traffic
Section titled “Interface traffic”This is inbound and outbound traffic on a port, shown in bits per second (bps, kbps, Mbps, Gbps). The number to keep in mind is utilisation — the traffic rate as a fraction of the link’s rated speed. 500 Mbps on a 1 Gbps link is 50% utilisation; the same 500 Mbps on a 10 Gbps link is only 5%.
| What you’ll see | |
|---|---|
| What it means | How much data is flowing through the port each second, in and out. |
| Healthy | Utilisation comfortably below the link speed, with headroom for bursts. Most links sit well under 50% on average. |
| Concerning | Sustained utilisation near the link’s rated speed (often 80–90%+), especially during business hours. Brief peaks are normal; a flat line pinned at the top is not. |
| First action | Confirm the link’s real speed, then check whether the saturation is sustained or bursty. If sustained, identify what’s driving it (a backup, a misbehaving host, organic growth) and plan capacity — a faster link, load balancing, or traffic shaping. |
A saturated uplink is one of the most common causes of “the network is slow” complaints, so uplinks and trunks are the interfaces most worth a threshold.
Interface errors and discards
Section titled “Interface errors and discards”Beyond raw traffic, GridNMS tracks errors and discards on an interface. These are subtle but important — a port can be far from saturated and still be quietly corrupting or dropping traffic.
- Errors are frames the interface couldn’t process correctly — typically a physical-layer problem: a bad cable, a failing transceiver, a duplex mismatch, or electrical interference.
- Discards are frames the interface deliberately dropped — usually because a buffer or queue was full, which points to congestion or a configuration limit.
| What you’ll see | |
|---|---|
| What it means | The rate of frames that errored or were dropped on the port. |
| Healthy | Zero, or so close to zero it’s effectively flat. A clean link should show no errors at all. |
| Concerning | Any steady, non-zero error rate. Even a small but persistent trickle of errors usually means a real physical fault — errors don’t “self-heal.” A rising discard rate points to congestion. |
| First action | For errors: treat it as a hardware/cabling issue — reseat or replace the cable, check the transceiver, and verify both ends agree on speed and duplex. For discards: look at utilisation on the same port; if it’s high, the discards are congestion, and the fix is capacity or traffic shaping. |
Reachability and latency
Section titled “Reachability and latency”The most fundamental metric is simply: can GridNMS reach the device, and how long does it take to respond? GridNMS checks reachability continuously and records response time.
| What you’ll see | |
|---|---|
| What it means | Whether the device is up (responding) or down (not responding), and the round-trip response time. |
| Healthy | Up, with a low and steady response time consistent with its location on the network — local devices answer in single-digit milliseconds; remote sites are naturally higher but stable. |
| Concerning | Down (an outage — usually the most urgent signal GridNMS can give you), or a response time that climbs and stays high, or that swings wildly. Rising latency often precedes a hard failure. |
| First action | For a down device: confirm it’s a real outage and not a planned maintenance window, then check the path to it — is just this device down, or everything behind a common upstream? For high latency: check whether the device is overloaded (see CPU and memory below) or the path to it is congested. |
A device going down typically raises an event immediately. When several devices go down at once, look upstream — the real fault is often a single switch or link they all depend on, which the topology view can help you spot.
CPU load
Section titled “CPU load”CPU shows how hard the device’s processor is working, as a percentage. Network devices spend most of their time idle; a control-plane CPU pegged high is a sign of trouble.
| What you’ll see | |
|---|---|
| What it means | The percentage of processing capacity in use. |
| Healthy | Low to moderate, with brief peaks. Most network devices idle well under 30%. |
| Concerning | Sustained high CPU (consistently 80%+). Short spikes during a config change or a routing update are normal; a flat high line is not. |
| First action | Identify what’s consuming the CPU — a routing loop, a traffic storm, an SNMP or management process, or a software bug. Correlate with the traffic and error charts; a CPU spike alongside a traffic surge tells a clear story. Sustained high CPU on infrastructure can slow or destabilise everything behind it. |
Memory usage
Section titled “Memory usage”Memory shows how much of the device’s RAM is in use.
| What you’ll see | |
|---|---|
| What it means | How much memory the device is consuming, as a percentage or amount. |
| Healthy | Steady, well below capacity. Healthy devices settle at a stable working level. |
| Concerning | A reading that climbs steadily over time without leveling off — a classic memory-leak signature — or one consistently near capacity. Unlike CPU, memory pressure tends to build slowly, so the trend matters more than any single reading. |
| First action | Check the trend over a long time range (days, not minutes). A steady climb suggests a leak — a firmware update or a scheduled reboot often resolves it. A consistently high but stable level may simply mean the device is undersized for its role. |
Disk usage
Section titled “Disk usage”For devices that report it — servers, storage, and some appliances — GridNMS tracks how full the storage is.
| What you’ll see | |
|---|---|
| What it means | The percentage of disk or storage capacity consumed. |
| Healthy | Comfortably below full, with room to grow. |
| Concerning | Climbing toward full. Disk problems are unusual in that the danger is the trend, not a spike — a slowly filling disk gives you warning, but a disk that hits 100% can take services down hard. |
| First action | If it’s climbing, find what’s growing — logs, snapshots, backups, a runaway process — and reclaim or expand space before it fills. Set a threshold so you’re warned at, say, 85% rather than discovering it at 100%. |
Turning a reading into an alert
Section titled “Turning a reading into an alert”Reading charts is reactive — you have to be looking. Thresholds make it proactive: you tell GridNMS the level that counts as a problem, and it watches for you around the clock.
When a metric crosses its threshold, GridNMS raises an event at the severity you chose and, if you’ve set up delivery, sends a notification. To avoid alert storms from a value that flickers right at the line, a threshold has to stay crossed for a few consecutive checks before it raises an event, and has to fall back for the same number of checks before it clears.
Where you set thresholds depends on the metric:
- Interface traffic thresholds (inbound/outbound bandwidth) are set per interface — see Working with Interfaces.
- System metrics like CPU, memory, and disk are watched by thresholds that come from the device’s monitoring pack and can be tuned per class of device.
A good threshold is set where you’d genuinely want to be woken up — high enough that it doesn’t cry wolf, low enough that it gives you time to act. Start a little conservative, watch how often each alarm fires, and tighten from there.
Related pages
Section titled “Related pages”- Monitoring & Metrics — how GridNMS collects and stores all of this in the first place.
- Working with Interfaces — set per-interface bandwidth thresholds.
- Events & Alerts — triage the events that thresholds raise.