Cases
When something goes wrong, the signals rarely arrive as a single tidy alert. You get a cluster of events across several devices, a few suspicious log lines, and maybe a service that started timing out — all part of the same underlying problem. A Case is the container that ties those pieces together so one person can own the investigation, gather the evidence, write down what they found, and drive it to a fix.
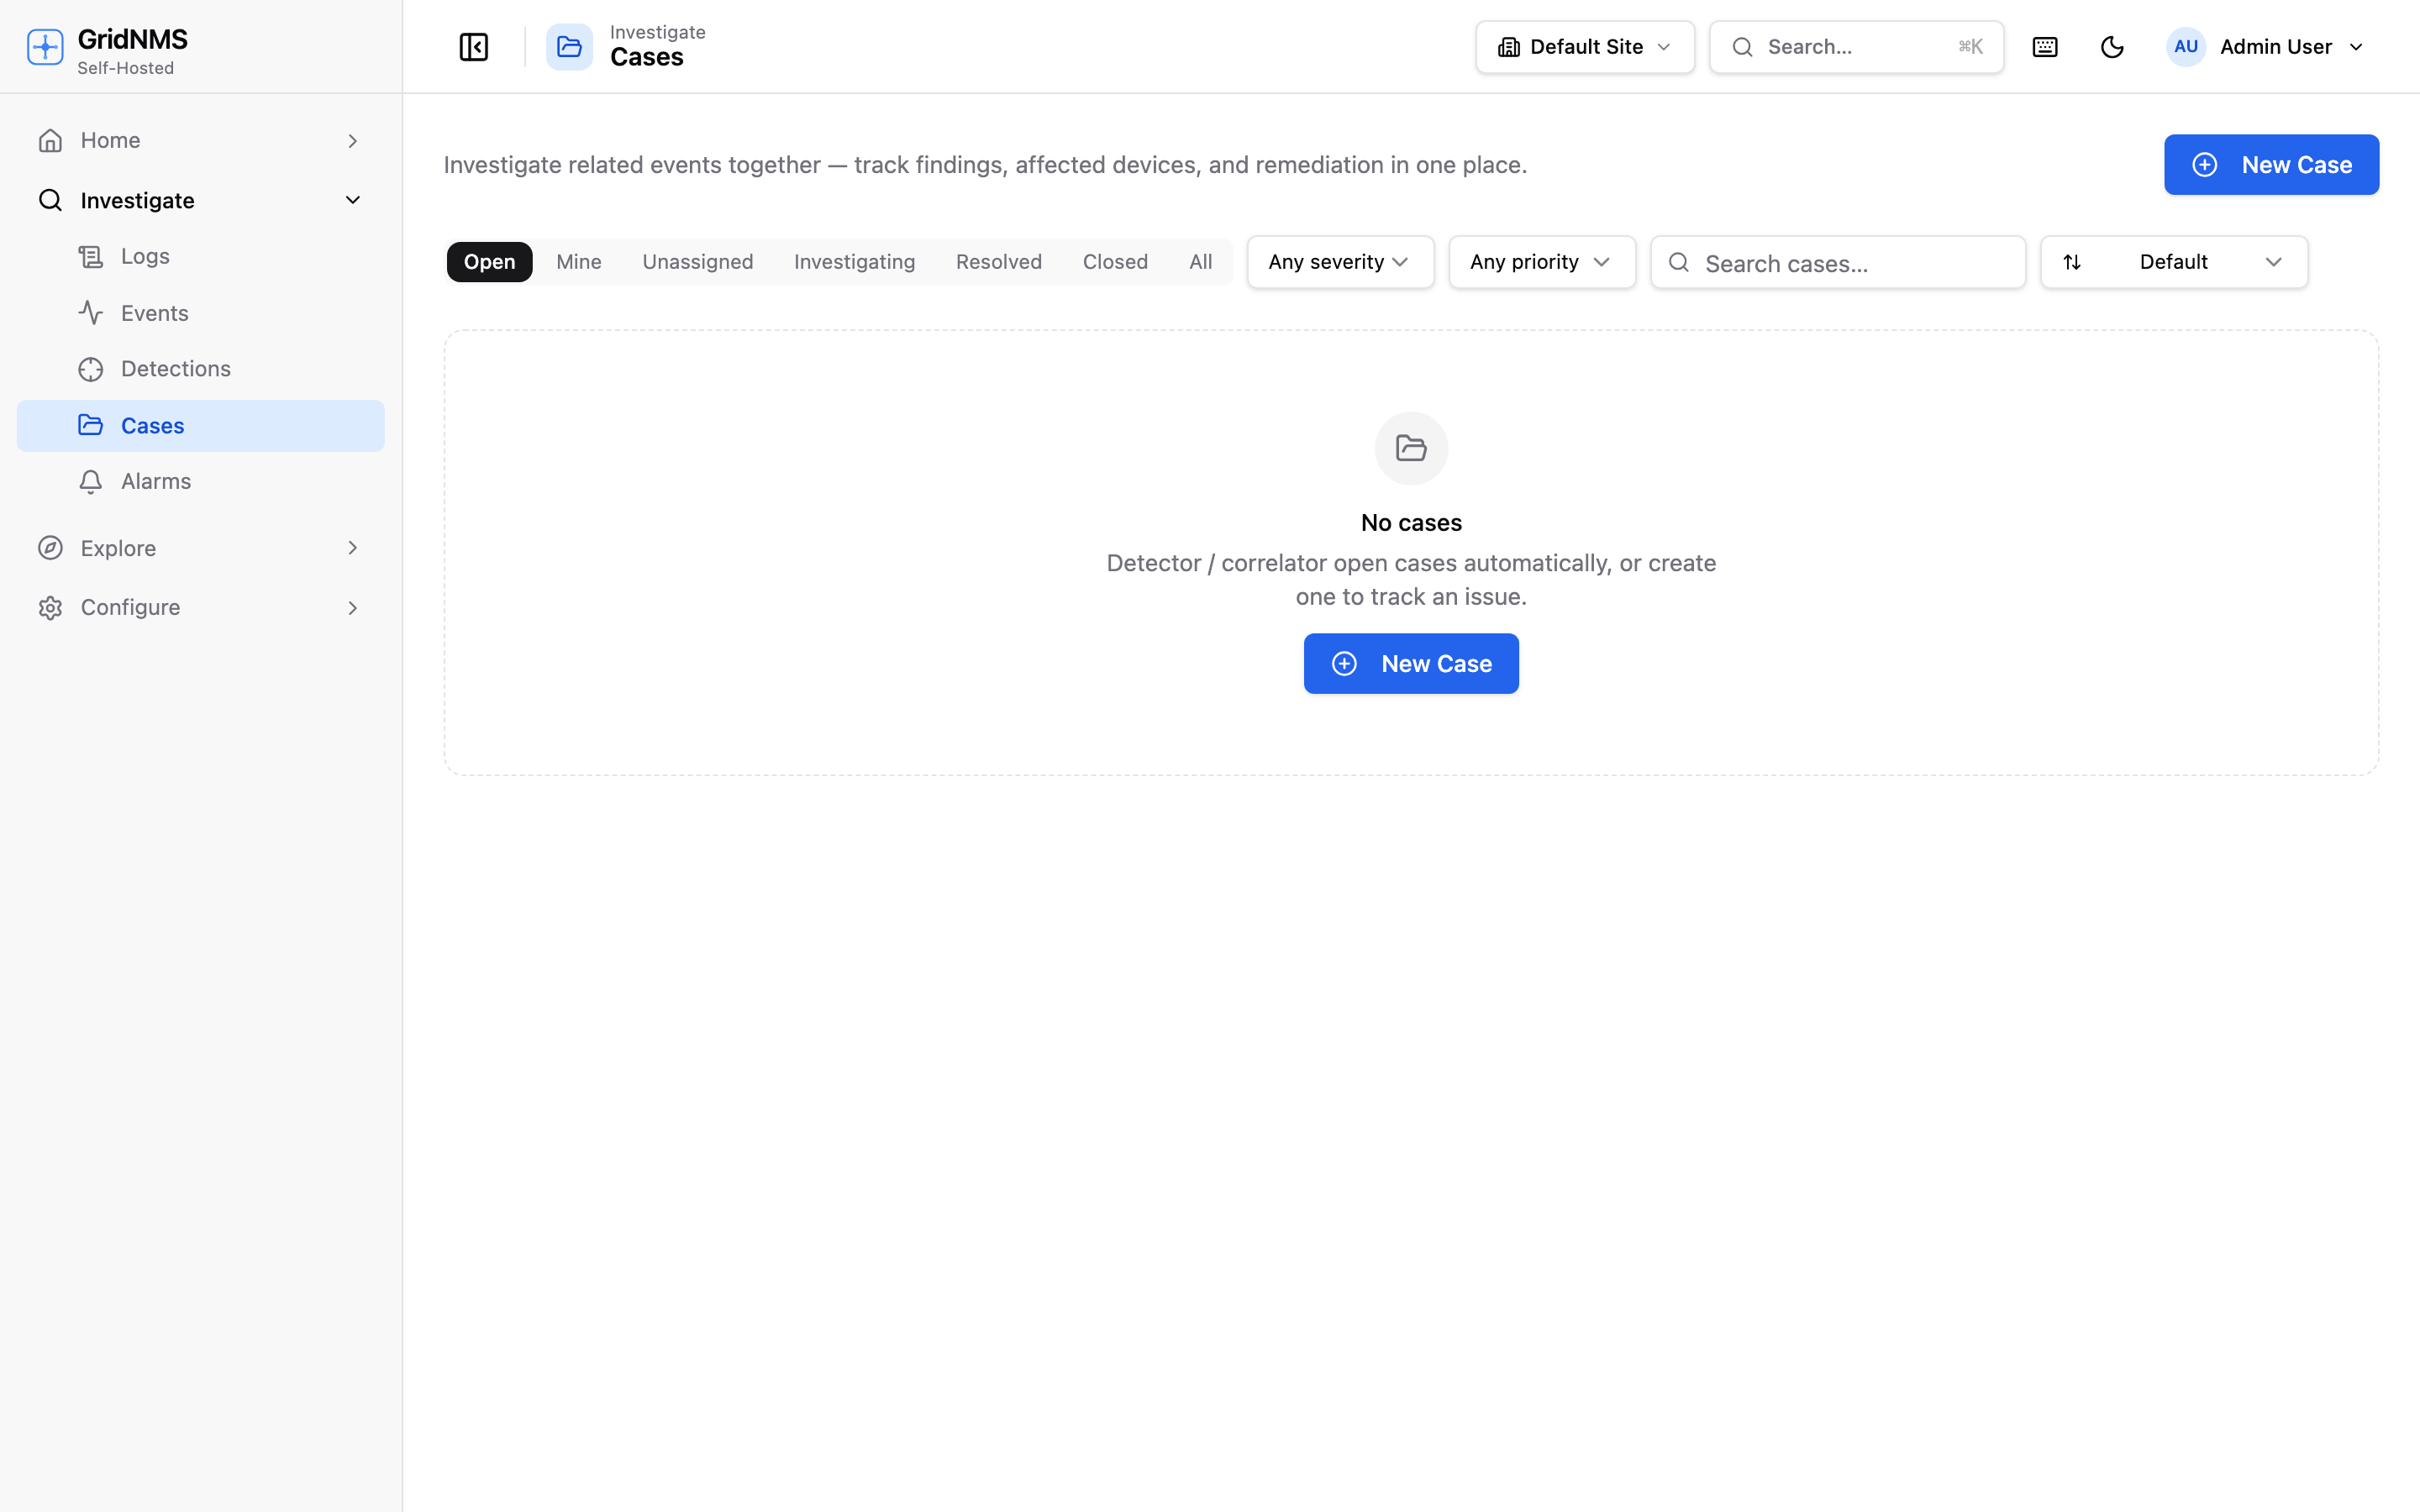 The Cases page lists open investigations with their status, severity, assignee, and how many events each one groups.
What a case is for
Section titled “What a case is for”Think of a case as an investigation file. Instead of chasing a dozen separate alerts, you pull the related ones into a single case and work the problem in one place. A case keeps together:
- The events that belong to the same incident.
- The devices affected.
- A timeline of evidence — log lines, metric readings, and notes, in order.
- The findings and remediation you write up as you go.
- The status, severity, owner, and assignee so the team knows where it stands.
Where to find it
Section titled “Where to find it”Open Investigate → Cases. The list shows every case with its status, severity, assignee, the number of events it groups, and how it was created. Click a row to open the case workbench — the full detail view where the investigation happens. A search box and status filters help you find a specific case in a long list.
How cases get created
Section titled “How cases get created”Cases come into existence two ways:
Automatically
Section titled “Automatically”GridNMS opens cases for you when activity correlates:
- From a detection — a detection can be set to open a case on match, so a meaningful pattern in your logs becomes a ready-made investigation instead of just another event.
- From correlated activity — when related events cluster together, GridNMS can group them into a single case automatically rather than leaving you to connect the dots.
Auto-created cases are labelled by origin (for example Detector or Correlated) so you can tell at a glance which were machine-generated.
Manually
Section titled “Manually”Click New Case to start one yourself when you’ve spotted something worth investigating. Give it a title, a severity, and a short description, then start attaching evidence. Manually created cases are labelled Manual.
The case workbench
Section titled “The case workbench”Opening a case gives you a working surface built around the investigation.
Status, severity, and ownership
Section titled “Status, severity, and ownership”At the top you set where the case stands and who’s on it:
| Status | Meaning |
|---|---|
| Open | New — not yet being worked. |
| Investigating | Someone is actively working it. |
| Resolved | The problem is fixed; pending final close. |
| Closed | Done and archived. |
You can also set the severity, assign the case to a person, and add tags to group related work. Assignment and status are the two things teammates look at first, so keep them current.
Linked events and devices
Section titled “Linked events and devices”The case lists the events rolled into it. You can attach more events by browsing or searching — optionally limited to just the devices already on the case — and detach any that turn out not to belong. The devices involved are tracked alongside, giving you the full blast radius in one view.
The investigation timeline
Section titled “The investigation timeline”The heart of the workbench is a timeline you build as you investigate. From within the case you can browse and pin evidence directly onto it:
- Log lines — search across your logs (optionally scoped to a device) and attach the relevant lines as timeline entries.
- Metric data points — chart a device metric or a monitored service’s response time over a fixed window, then log a specific point onto the timeline to capture exactly what a value was at a moment that matters.
- Alarms — attach a threshold alarm that fired as part of the story.
Each pinned item lands on the timeline with its timestamp, building an ordered, evidence-backed account of what happened and when.
Notes, findings, and remediation
Section titled “Notes, findings, and remediation”Alongside the timeline you keep the narrative: free-form notes as you work, a summary of what you found, and the remediation — what was done (or needs to be done) to resolve it. This is what turns a closed case into something useful later: the next person who hits a similar problem can read exactly how this one was handled. An activity log records the case’s own history — status changes, assignments, and attachments — automatically.
Closing a case
Section titled “Closing a case”When the problem is fixed and written up, set the status to Resolved and then Closed. Closing records who closed it and when. A closed case stays fully searchable, so it becomes part of your team’s institutional memory — a record of what broke, how you knew, and how you fixed it.
How cases fit with everything else
Section titled “How cases fit with everything else”| Source | How it becomes a case |
|---|---|
| Detections | A detection set to open a case on match creates one automatically. |
| Correlated events | Related events are grouped into a single case. |
| You | Start a New Case manually and attach evidence. |
Where to go next
Section titled “Where to go next”- See where the raw alerts come from on Events & Alerts.
- Turn log patterns into auto-opening cases with Detections.
- Search the logs you’ll attach as evidence in Logs & Log Search.