GridNMS Cloud (SaaS)
Nothing to install on a server — sign up, deploy one lightweight collector near your network, and you’re monitoring in minutes.
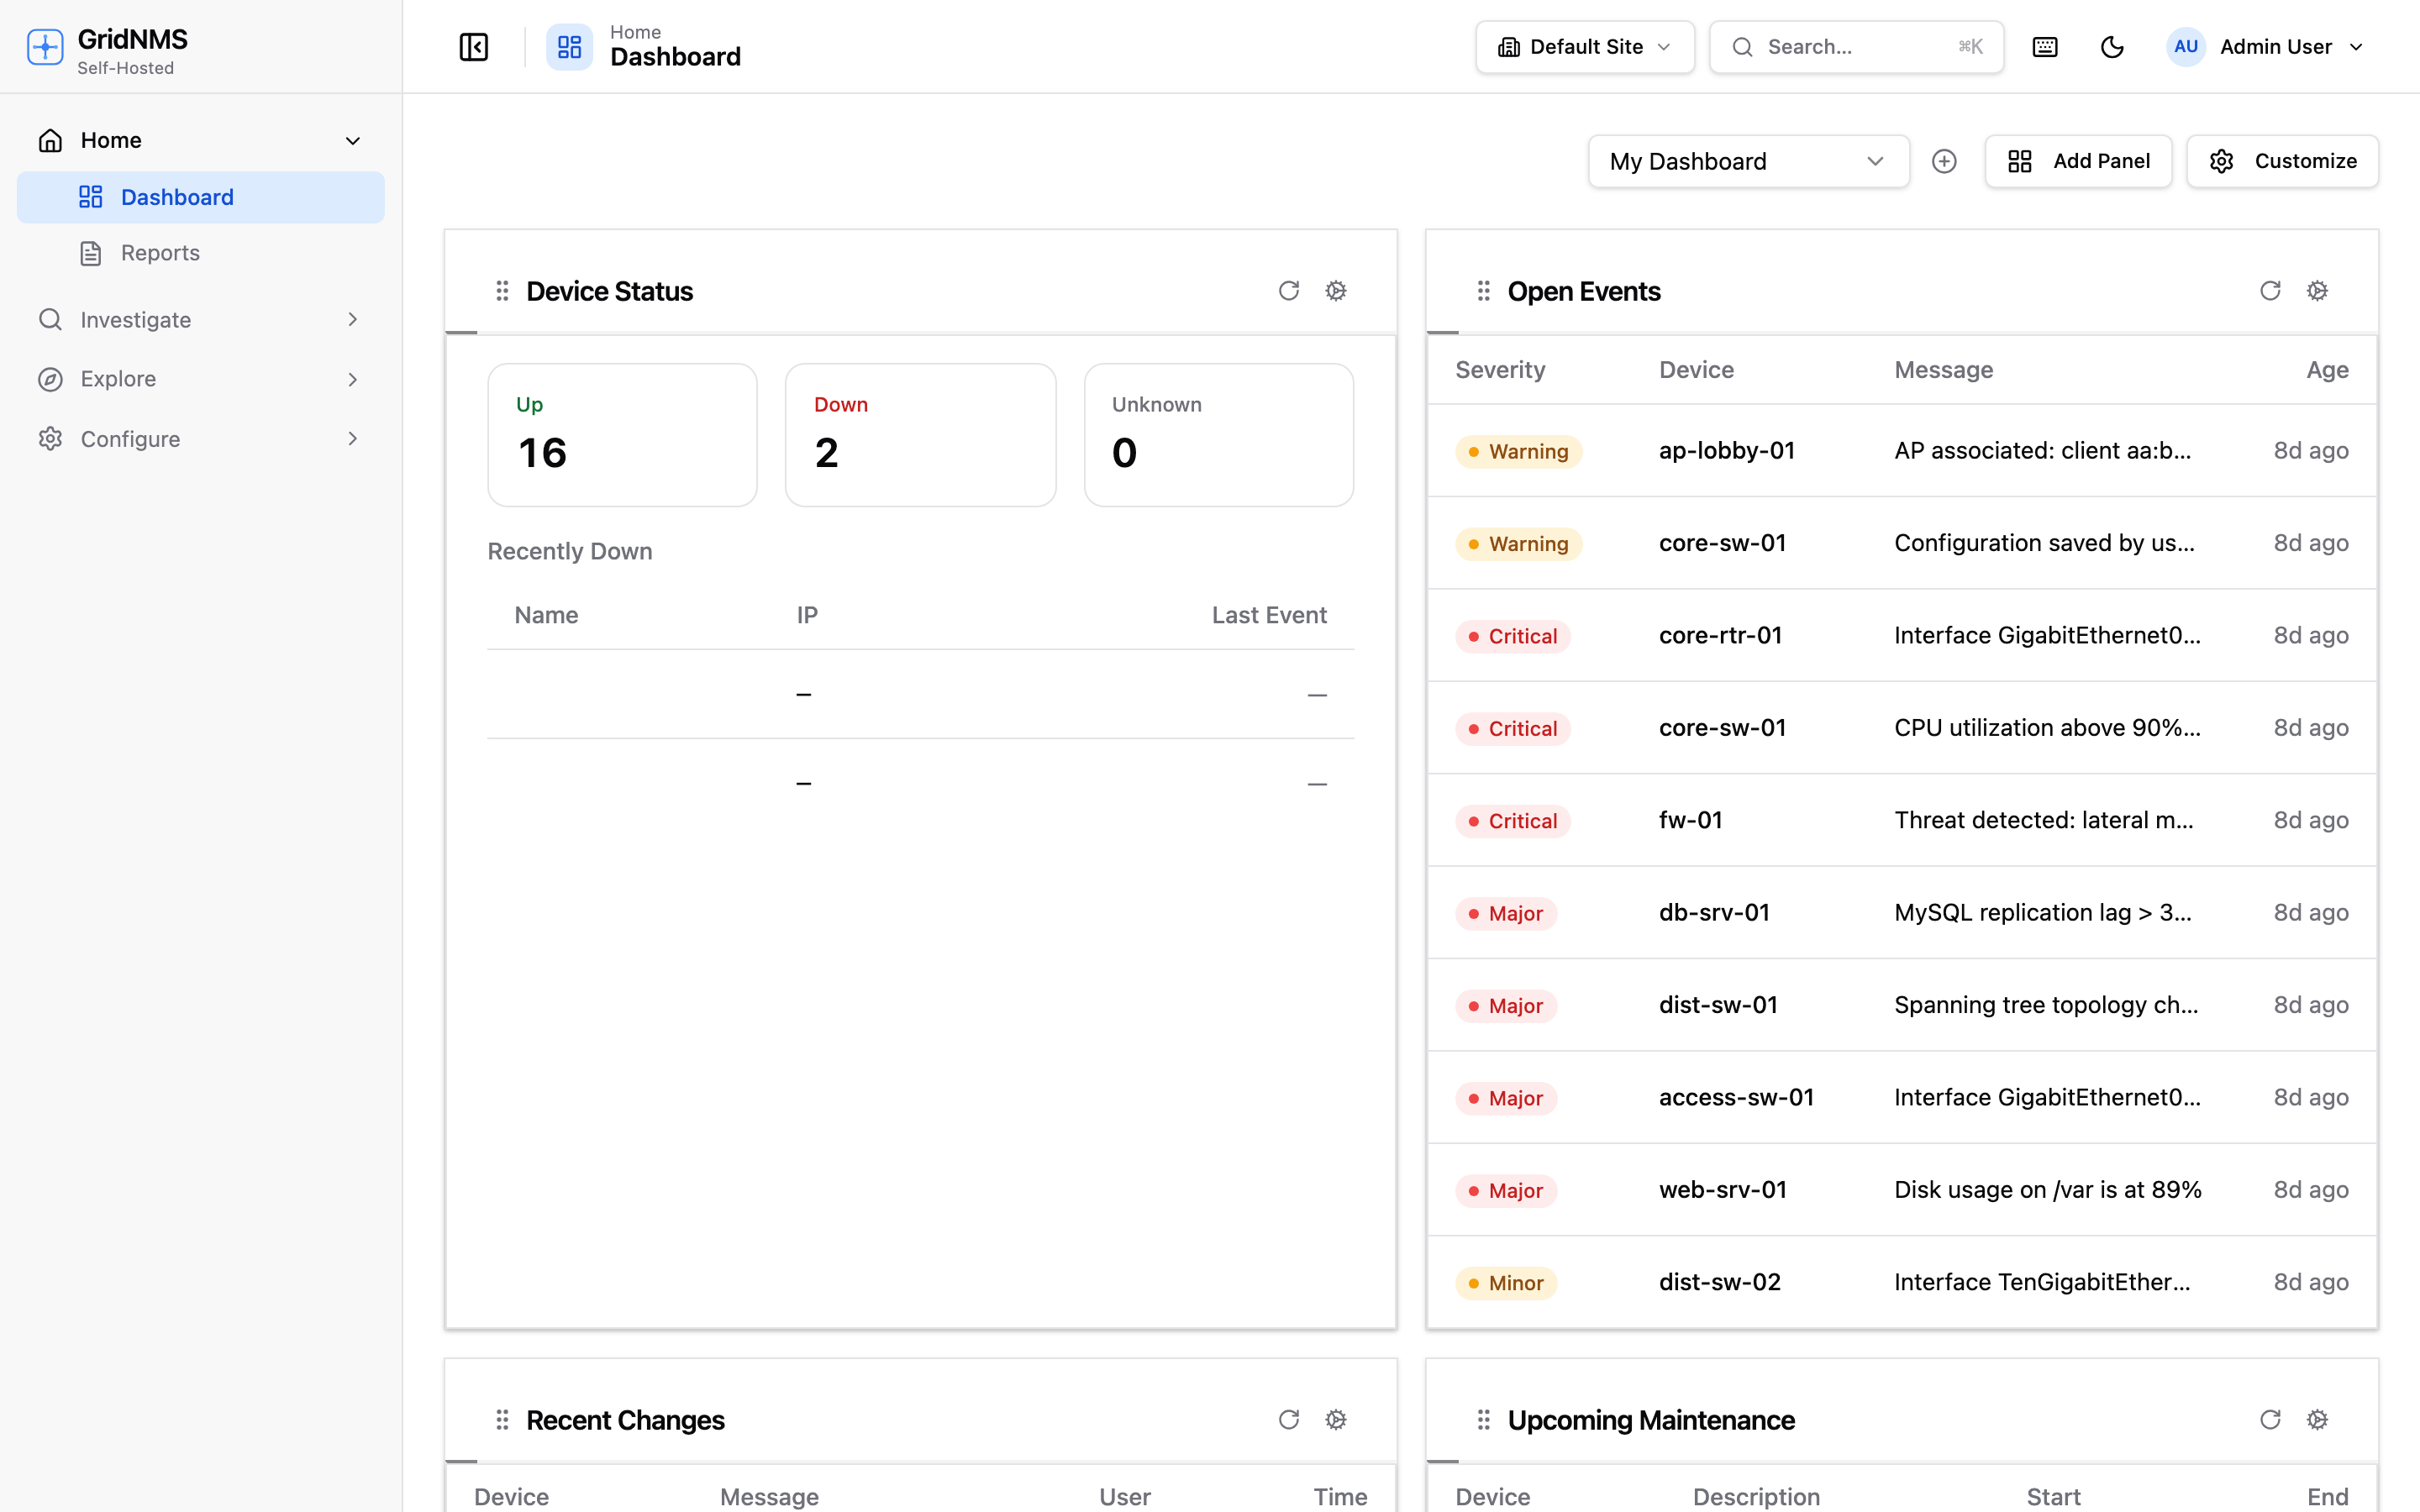 A single pane of glass: device status, open events, recent changes, and metrics — all on one screen.
GridNMS Cloud (SaaS)
Nothing to install on a server — sign up, deploy one lightweight collector near your network, and you’re monitoring in minutes.
Self-Hosted
Run the whole platform on your own infrastructure with Docker — your data stays on your network.
Connect your network
Collectors are the lightweight agents that watch your devices and receive syslog and SNMP traps. One per site or segment.
Learn the product
Walkthroughs and how-tos for everything you’ll do day to day — devices, discovery, topology, alerts, logs, and reports.
New here? Start with Welcome to GridNMS or jump straight to choosing a deployment. Questions? Email support@gridnms.io.